The RTX 4090D is Only 5% Slower than the RTX 4090, Extensive Testing Reveals Minor Performance Difference
The RTX 4090 recently faced the wrath of US sanctions, forcing a complete ban in various regions including China. NVIDIA prepared a cut-down version of the RTX 4090D to circumvent this ban, complying with US laws and regulations.
A review from Expreview shows that the RTX 4090D lags behind its bigger brother by only 5%. For context, NVIDIA did scale back the RTX 4090D by a small margin so there was an expected performance penalty.
RTX 4090D: Specifications
The RTX 4090D packs 14592 CUDA cores, 10% lower than the RTX 4090. The RT and Tensor core counts also take a slight hit since, with slightly higher base clocks. Other than that, the TDP has been reduced from 450W to 425W alongside no support for overclocking.
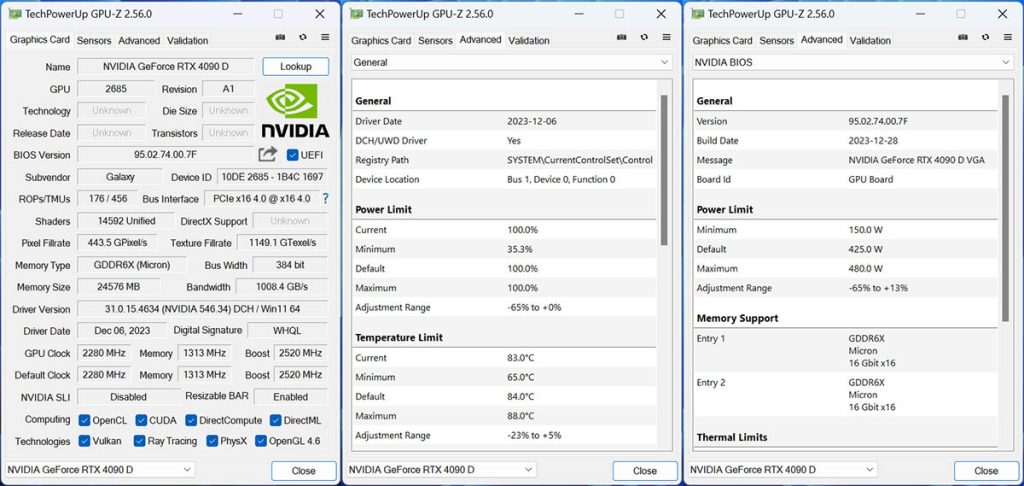
Expreview employed the GALAX RTX 4090D Metal Master paired with an Intel i9-13900KS on an ASUS ROG MAXIMUS Z790 DARK HERO motherboard. Faster memory equates to better performance, thus 2 sticks of 16GB DDR5-7200 (CL34) were slotted in and ready to go.
Performance Benchmarks
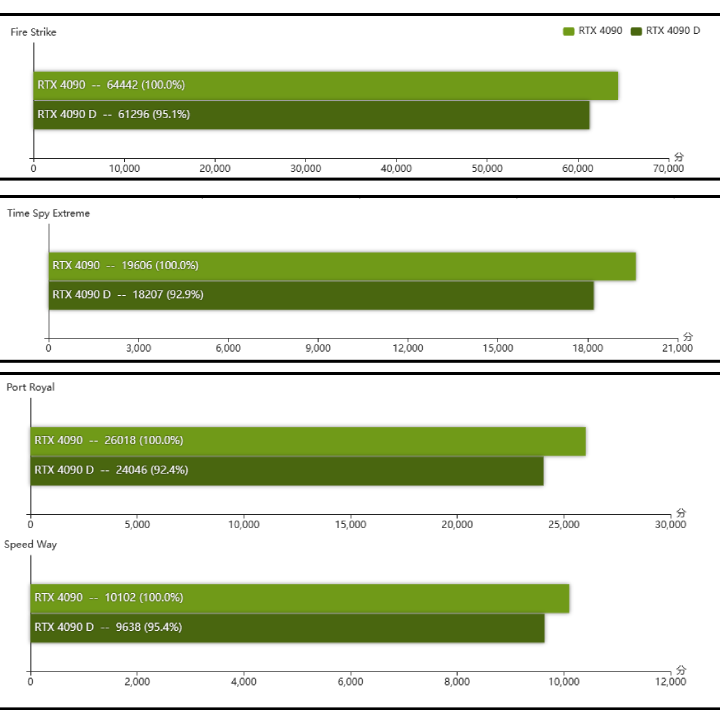
First off, let’s start with synthetic tests, where there is a 5-8% variation between the benchmarks. The RTX 4090D comes within 4.6% of the RTX 4090 in Speed Way, though on the contrary, the delta between the two expands to 7.6% in Port Royal.
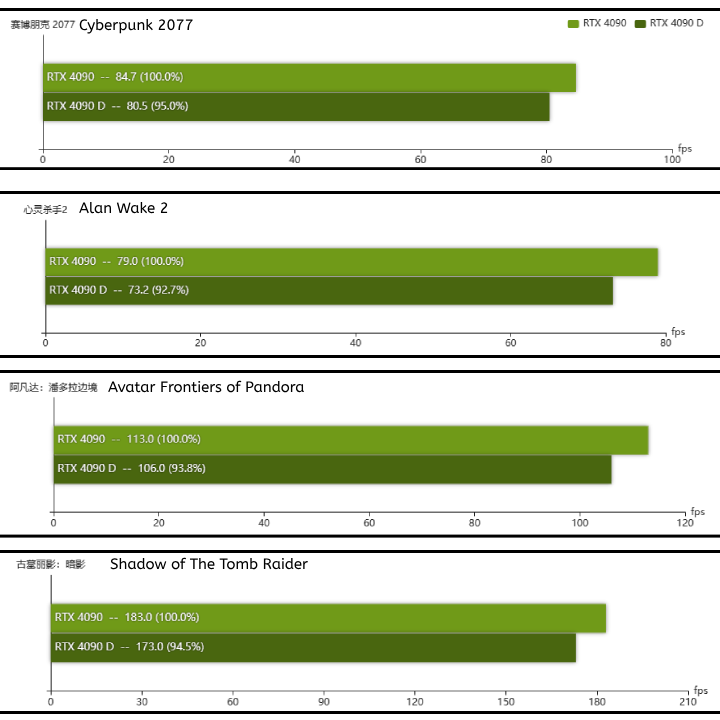
In the gaming department, the difference is more or less the same. At 4K settings, the RTX 4090D is capable of playing even the most demanding titles such as Alan Wake 2 without breaking a sweat.
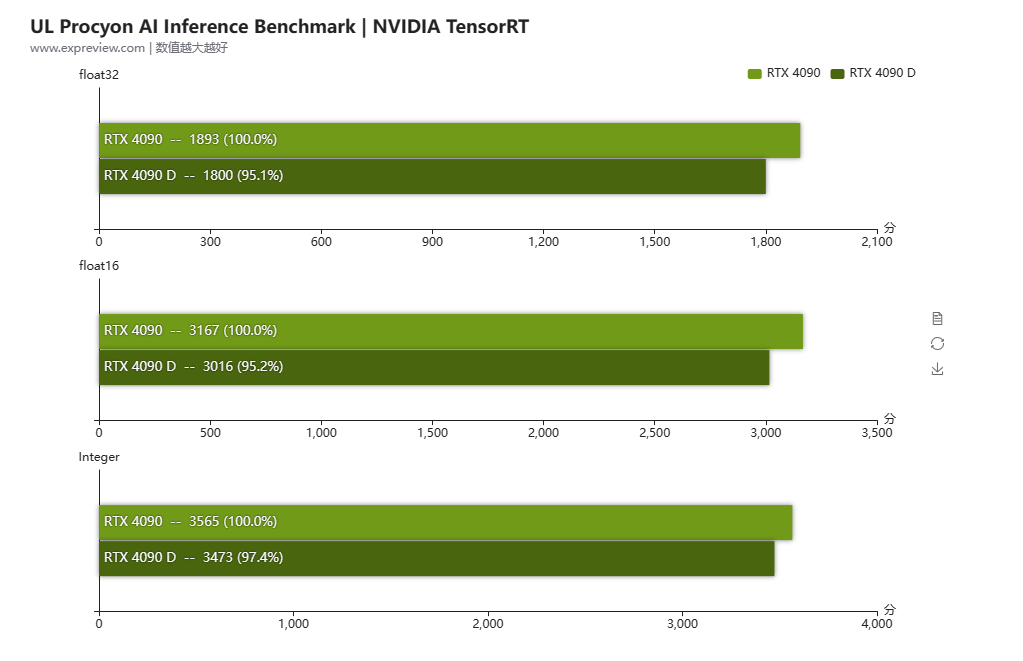
In UL Procyon’s AI Inference test, using the NVIDIA TensorRT API the RTX 4090D offers 95% of the performance of an RTX 4090 in single-precision/double-precision floating point operations. Moving over to integer performance, the RTX 4090D is neck to neck against the RTX 4090, being just 2.6% behind.
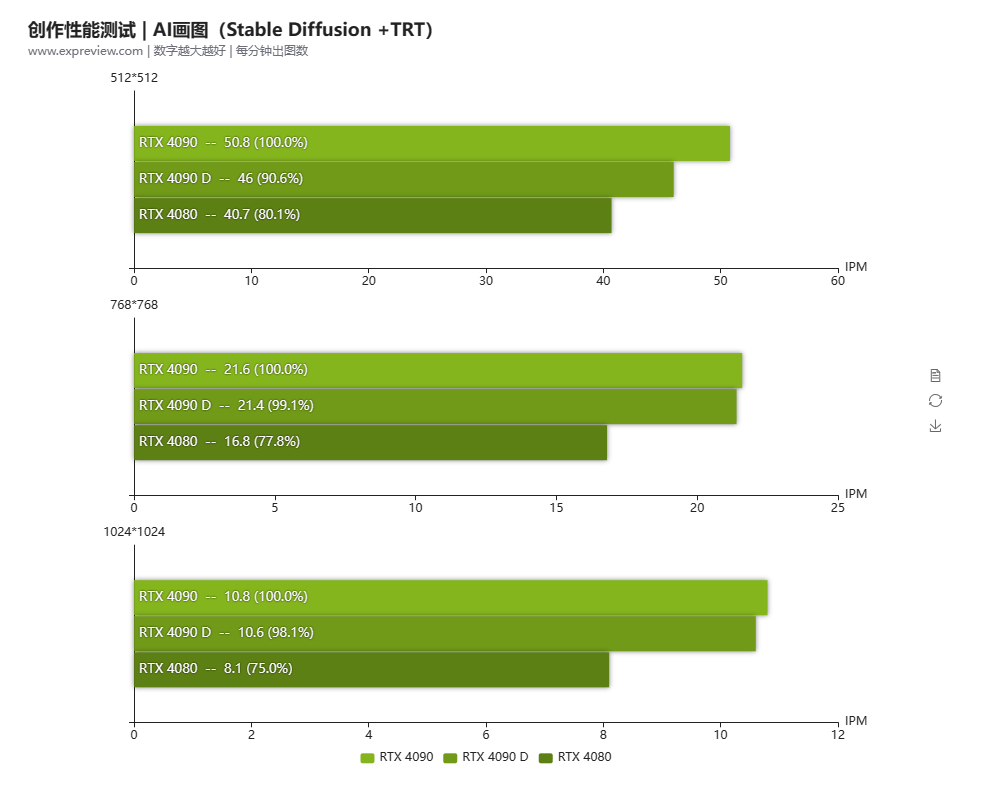
In Stable Diffusion, using presets of Batch Size 1, Batch Count 10, CFG Scale 7, Sampling Steps 50, the RTX 4090D trails behind in by 10% in the 512*512 resolution. As we bump up the pixel count, this gap shrinks to as low as 0.9%.
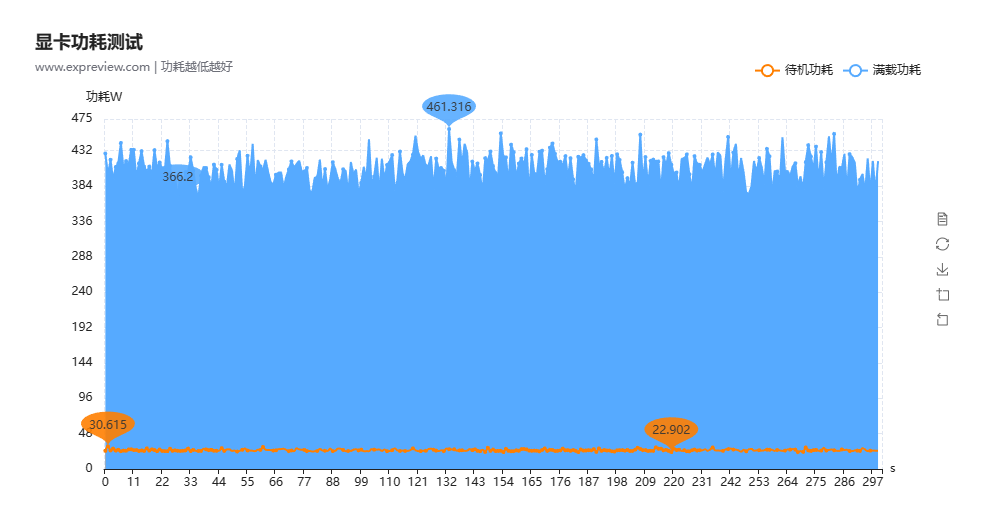
Using NVIDIA’s PCAT kit, Expreview measured the power consumption of the RTX 4090D, when stressed using 3DMark Time Spy Extreme. The highest peak seen is at 461W, though the average is well under the described TDP at just 408W. The review recommends a decent PSU of 1000W of higher, since we’re not factoring in other components yet.
Summary
To sum things up, the RTX 4090D falls behind the RTX 4090 by just 5%. In most tasks, the difference is minimal, and even for productivity, you’ll likely see similar results as you’d find in gaming.
For the average consumer, the RTX 4090 is still a no-brainer, however, the Chinese market can rejoice since despite nerfed specs, the RTX 4090D is capable enough to float through any task effortlessly.
While written in Chinese, we highly recommend readers to go over the original review by Expreview, since we’ve skipped out many details to keep this article short any concise.
Source: Expreview