How to Monitor your Network using ipMonitor
Computer networks are becoming more and more common these days. Their use is now much more demanded than ever. This is all due to the rapid advancements in technology and our lives slowly but surely becoming more and more digital. Nowadays, most of the businesses are being conducted online whether it be communication or providing services. Everything is over a network, and for this purpose, managing our networks have become much prominent. Unlike before, monitoring your networks has become way easier — thanks to the tons of automated tools that do everything you ask with just a few clicks.
With the increasing demand and use, networks become more and more complicated and handling them can be an issue. Especially when an issue takes it down and you have to go through to pinpoint the cause. We know that networks, now and then, tend to go down due to some issues faced by one of the connected servers. Now, you can’t stop these errors from appearing, however, what you can do is monitor your network at all times so that when such an issue pops up, it is dealt as soon as possible. In this article, we will be showing you how to monitor your network using a tool called ipMonitor. ipMonitor is a network management tool developed by Solarwinds Inc that you can use to monitor all of your servers and applications from a single web console.
Installing ipMonitor
Now, before we jump into the article and guide you through, first, let’s get the required tool installed on your system. You can get the ipMonitor tool from here for a free trial to see how it works. Go ahead and download the tool and then follow the given steps:
- After downloading the file, extract it to any desired location.
- Navigate to where you have extracted the setup file and run the setup.exe file.
- Wait for it to extract the required files. Once done, you will be prompted with the Installation Wizard.
- Click Next. Accept the license agreement and then click Next again.
- Afterward, it will ask you for a username and organization. Fill it in and then click Next.
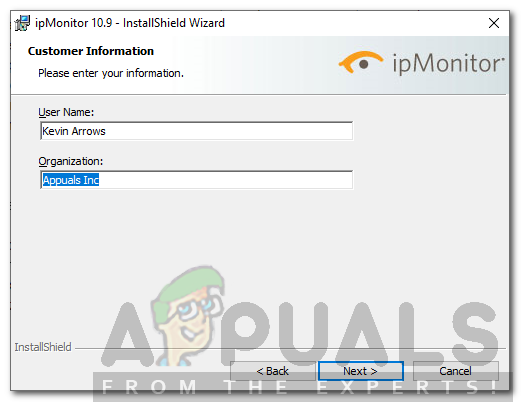
ipMonitor Installation - Select where you want to install the tool by clicking Browse and then click Next.
- Click Install and wait for it to finish.
- Once it has finished installing, click Finish.
- After that, the configuration wizard will open up automatically.
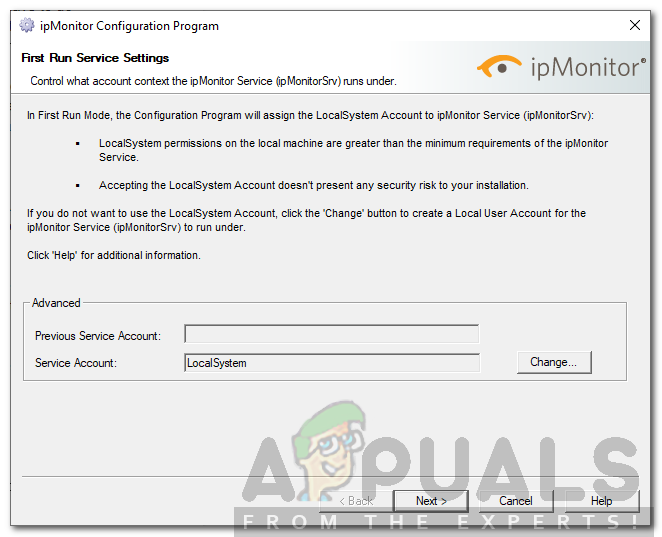
- On the first page (First Run Service Settings), just click Next.
ipMonitor Configuration Wizard - Afterward, select the HTTPS listening port for the SNMP Trap Listener and then hit Next. If you wish to create a customized connection, click on Change.
- Create a Standard ipMonitor account by filling in a username and a password. Click Next.
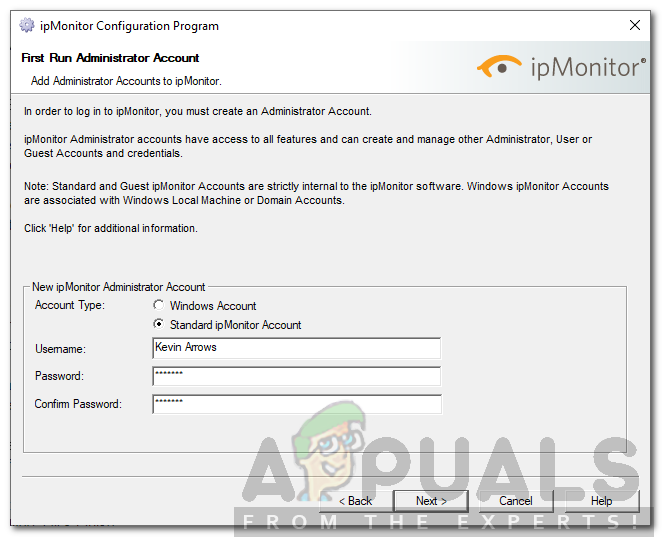
Creating an Administrator Account - Provide an email address where you will receive notifications about the status of the ipMonitor service. Click Next.
- Finally, click Finish.
- You will be prompted with a web console. Log in using the administrator account you created during the configuration wizard.
Scanning your Network
You now have successfully installed and configured the ipMonitor tool. Now, what we need to do is scan your network and then start monitoring it. Once you complete the configuration wizard, you will be prompted to a web user interface. Log in to that using the login credentials. Once done, follow the below steps:
- Once you have logged in, you will be able to see the Getting Started page.
- Select Express discovery and then click Next.
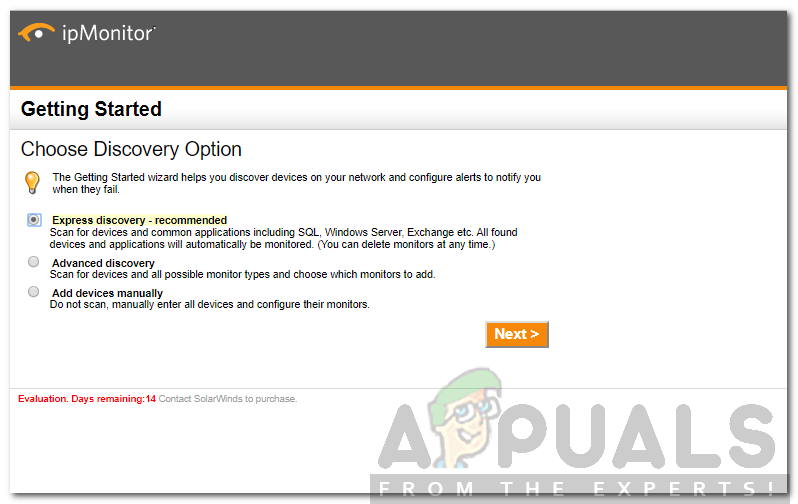
Getting Started Page - On the next prompt, you will be asked to choose the applications you want to monitor. Select whatever you would like to monitor and then click Next.
- After that, provide an IP address range to scan for your devices. Click Next.
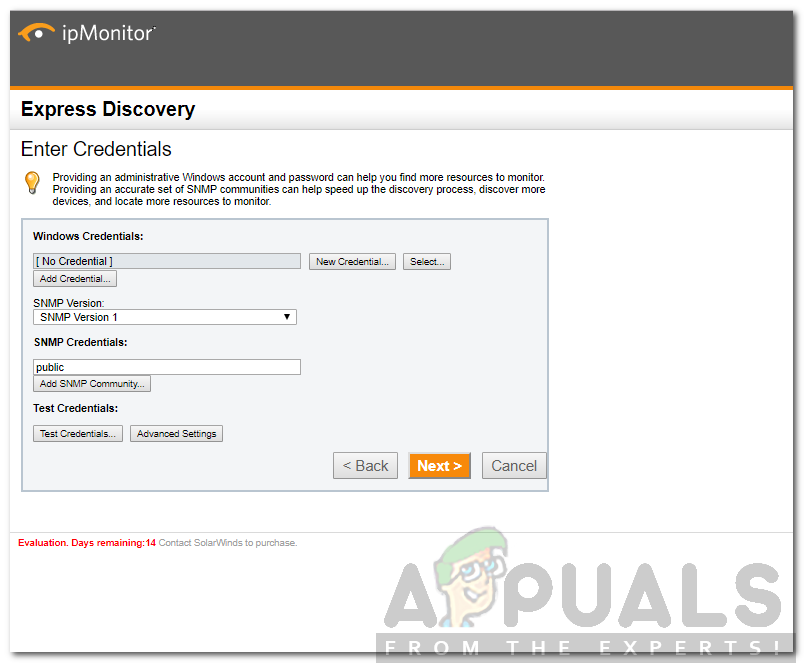
- Now, you will be asked to provide credentials if you wish to monitor Windows resources. If you do not want to do so, click Next. Otherwise, click New credential to start the Credentials Wizard.
- Give the credential a name and then click Next.
- Now, provide the login credentials and then hit Next.
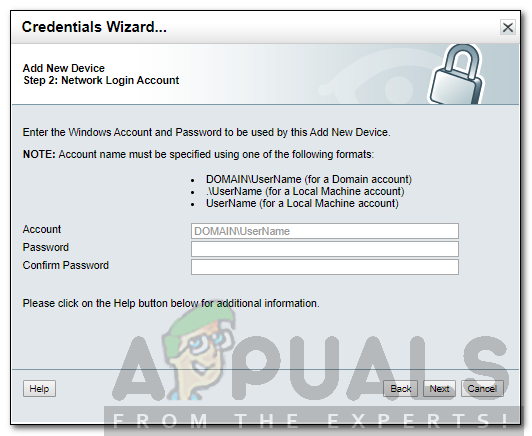
Credentials Wizard - Afterward, choose whether you want the credential to be used only by the administrator account or any account. Click Next and then click Finish.
- If you wish to use discover SNMP devices using community strings, click Add SNMP Community. Otherwise, just click Next.
Network Discovery Wizard - Enter an email where you would like to receive the alerts. Click Next.
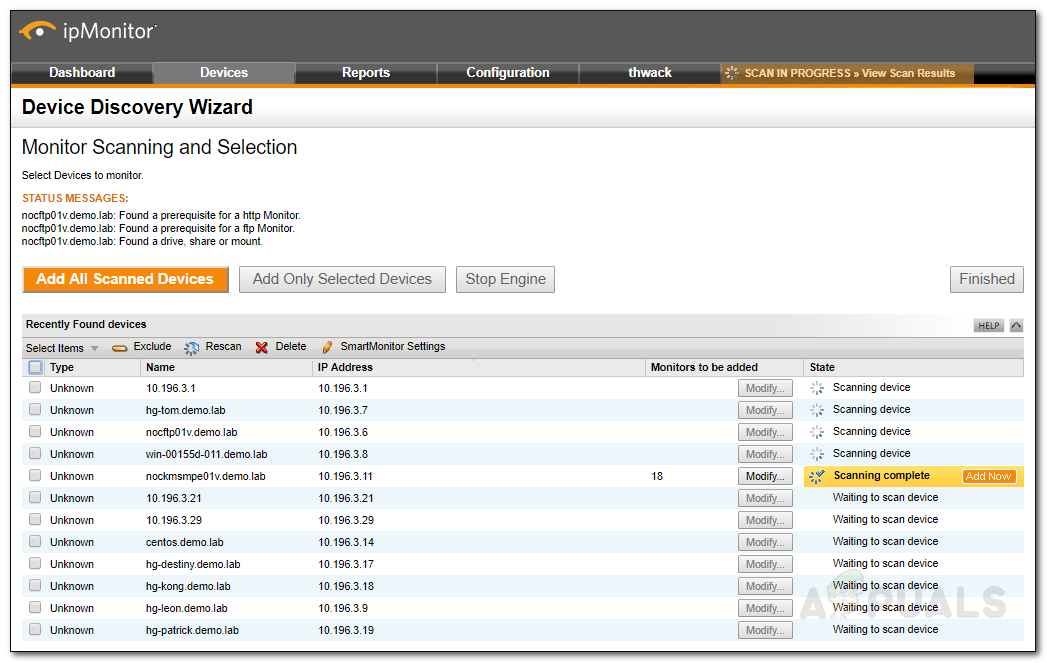
- It will start scanning, wait for it to complete.
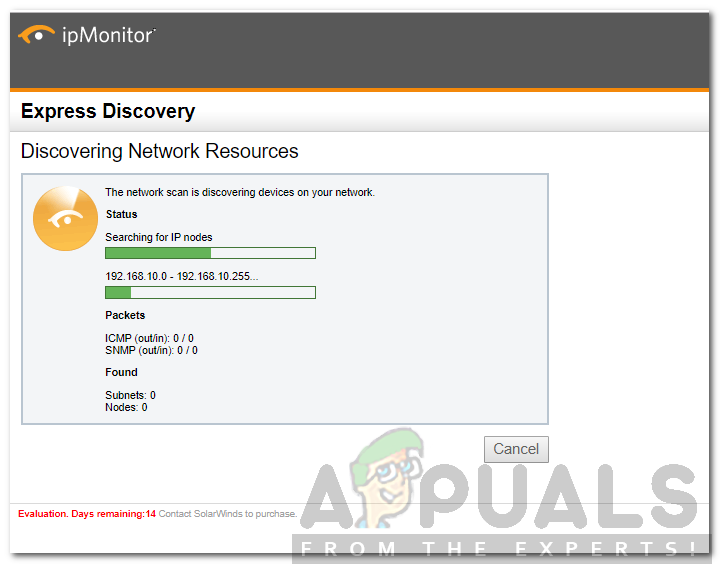
Scanning Network - Once the scan has finished, you will be able to see a green tab.
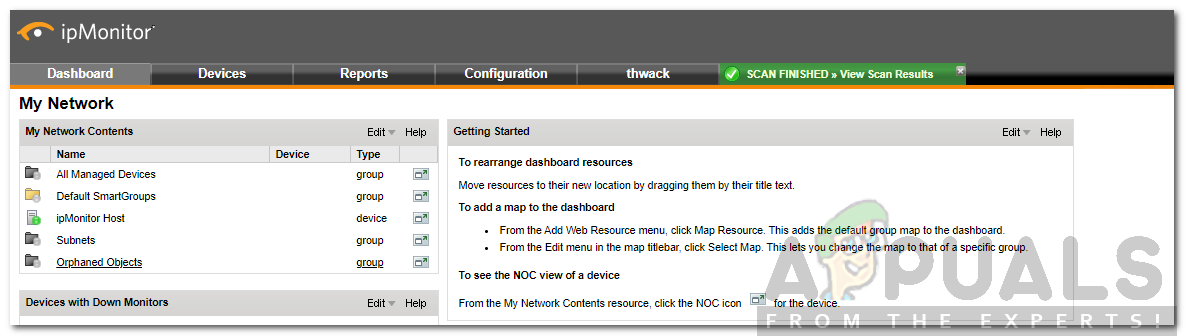
Scan Finished
Creating an Alert
Now that you have scanned your network, it is time to create some alerts for the added network. These alerts will notify you when an issue strikes your network. Here’s how to do it:
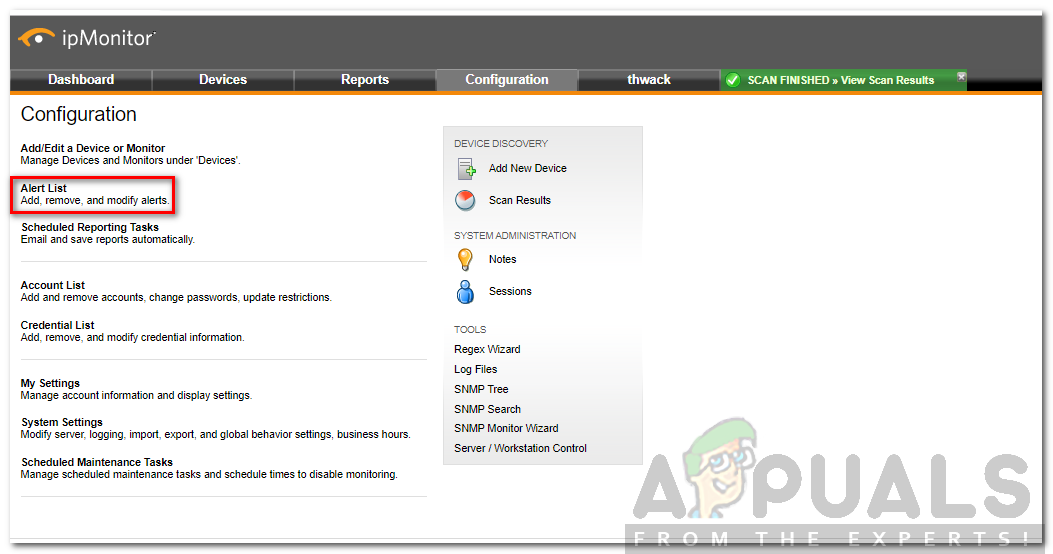
- Click on the Configuration tab.
- In the Configuration tab, click Alert List.
Configuration Tab - There, click on Alert Wizard.
- Choose ‘Create a simple email alert’ and click Next.
- Give the alert a name and provide an email address to which the alert is sent.
- Tick the ‘Email on recovery’ box so that you receive an email when the network has recovered. Also, make sure that the Activate Alert box is checked.
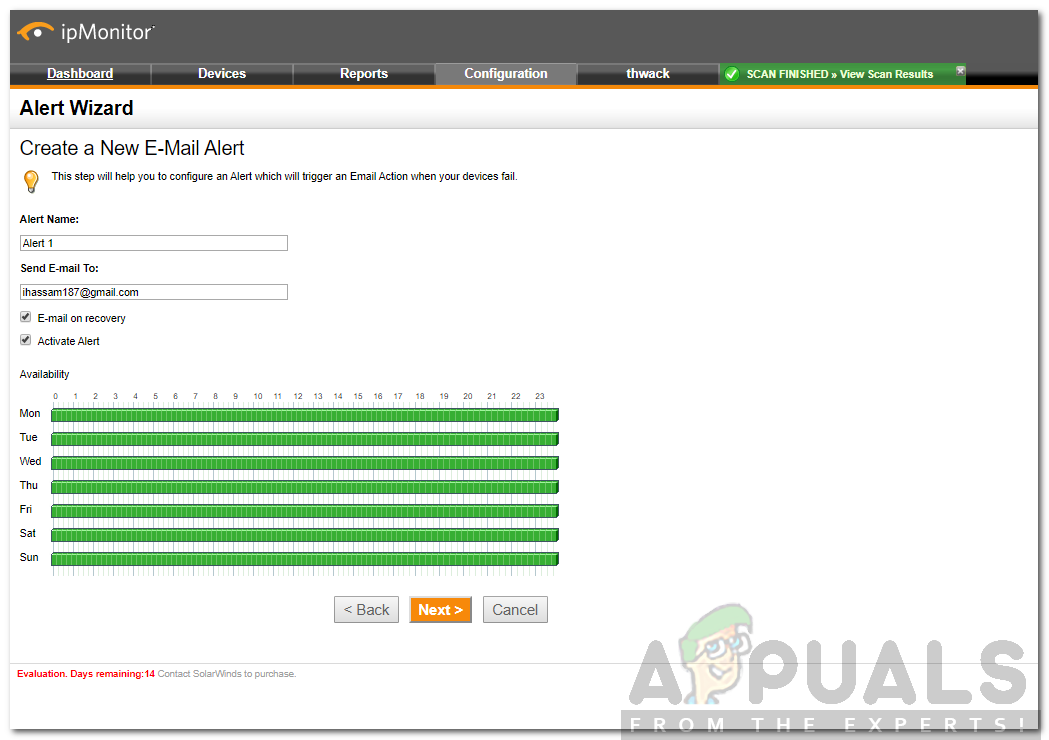
Creating an Alert - In the Availability graph, click on Monday and choose when the alert should be sent to you. Choose other days from the drop-down menu and click Copy to copy the same time for the other day. Do it for all the days and then click Next.
- Now, select a Monitor, device or group which triggers this alert. If you are not able to see any group, monitor or device, just click on the respective Add button. Then, click Next.
- Click on Create Alert to create the alert.
Performing Actions with an Alert
You can also make the tool take certain actions once a certain alert pops up e.g restart the service, reboot the server, etc. Here’s how to do it:
- On the Alert list page, click Add Alert.
- Give it a name and tick the Alert Enabled box.
- For Action Control, select ‘Alert for Groups, Devices, and Monitors that are listed’ so that the action is performed for all the monitors and groups that are listed down below when the alert is triggered. Select the second option if you wish the alert to be triggered for the monitors and groups other than the ones listed below.
- To add an action, click on the Add Action button and select an action. Provide the required fields for the action and then click OK.
- Add a Group, Monitor or Device to the alert.
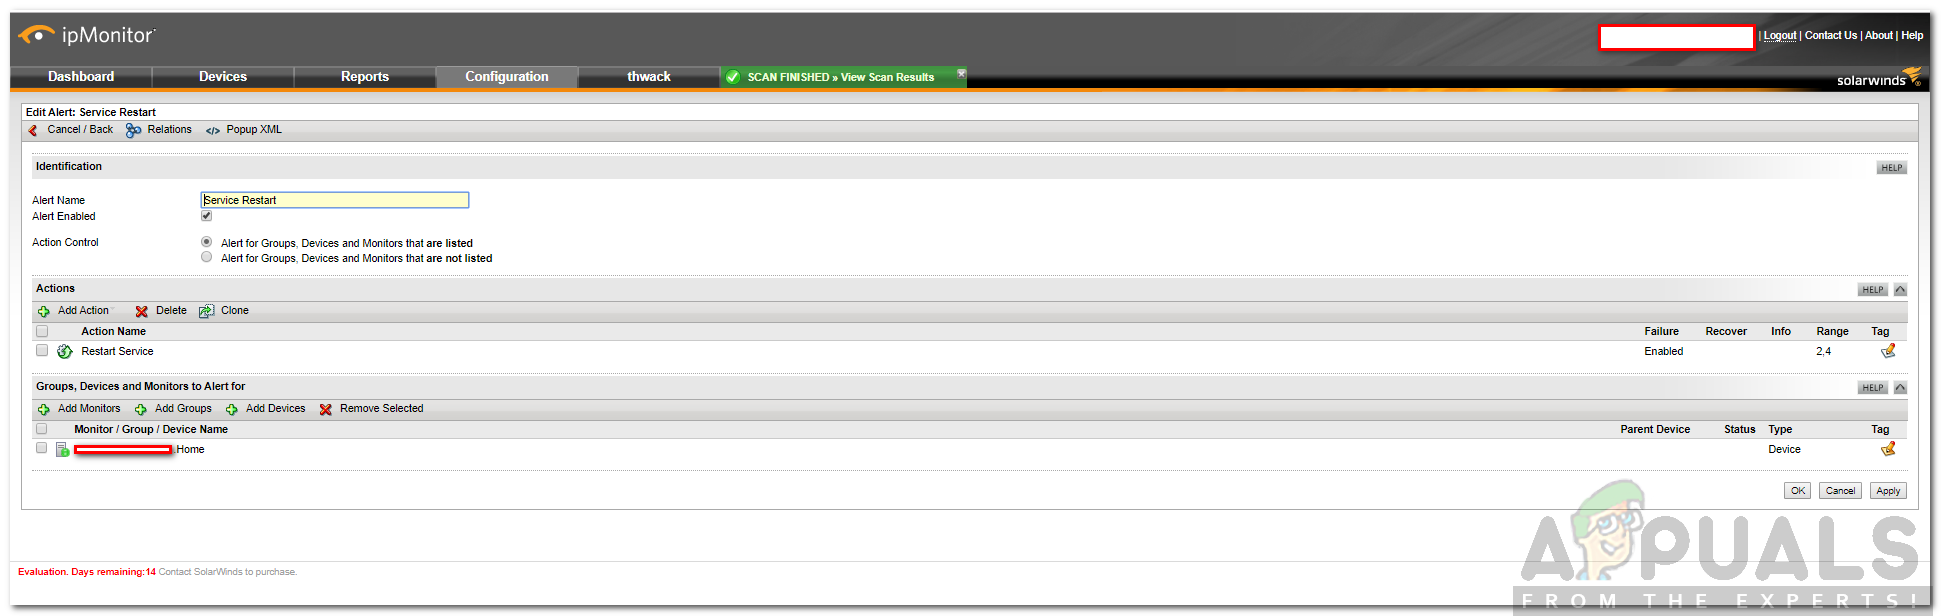
Adding an Action - Click Apply.