How to Monitor your Applications using AppOptics?
The use of applications is drastically increasing and more businesses or companies are opting for the use of applications to provide their services. This makes things easy as tasks are now becoming automated and the users can now approach the application much more easily due to the user-friendly interfaces. However, we do know that a rose is not without a thorn. Even though the use of applications is making things simpler and fast, there are other factors that you have to keep tabs on to provide an optimum and smooth experience. What’s that you may ask? With many more users now approaching online businesses and services, the applications being used by the network of a respective company or business at the backend need to be monitored.
It is imperative that you monitor the performance of your applications to provide a good experience to the users and for that, you will be needing automated tools. One cannot simply check the performance of all the applications running on their network manually, especially now that there are a whole bunch of automated tools available for the same purpose. Doing so would be absurd and it will waste a ton of your time which can be used in something more productive. Thus, in this article, we will be looking at the AppOptics product developed by Solarwinds which is an American company with an absolute reputation in network and system management fields. One of the benefits of using AppOptics is that it provides a cloud interface which is something to expect in this modern era, yet many tools lack it. Nonetheless, we will be showing you how to monitor your applications using AppOptics in the following paragraphs. Let us begin.
Installation of AppOptics
Installing AppOptics is pretty simple and straightforward and the required guidelines are provided once you get the tool. To be able to monitor your applications, you will either have to deploy the APM (Application Performance Monitoring) Agent on your system which will be responsible for collecting the required data on your applications. After you have implemented the agent, you will be able to monitor the performance of your applications using the AppOptics cloud interface. To get the tool, please head to this link and set up your account. Once you do so, your 14 days trial will commence. Here’s how to do the rest:
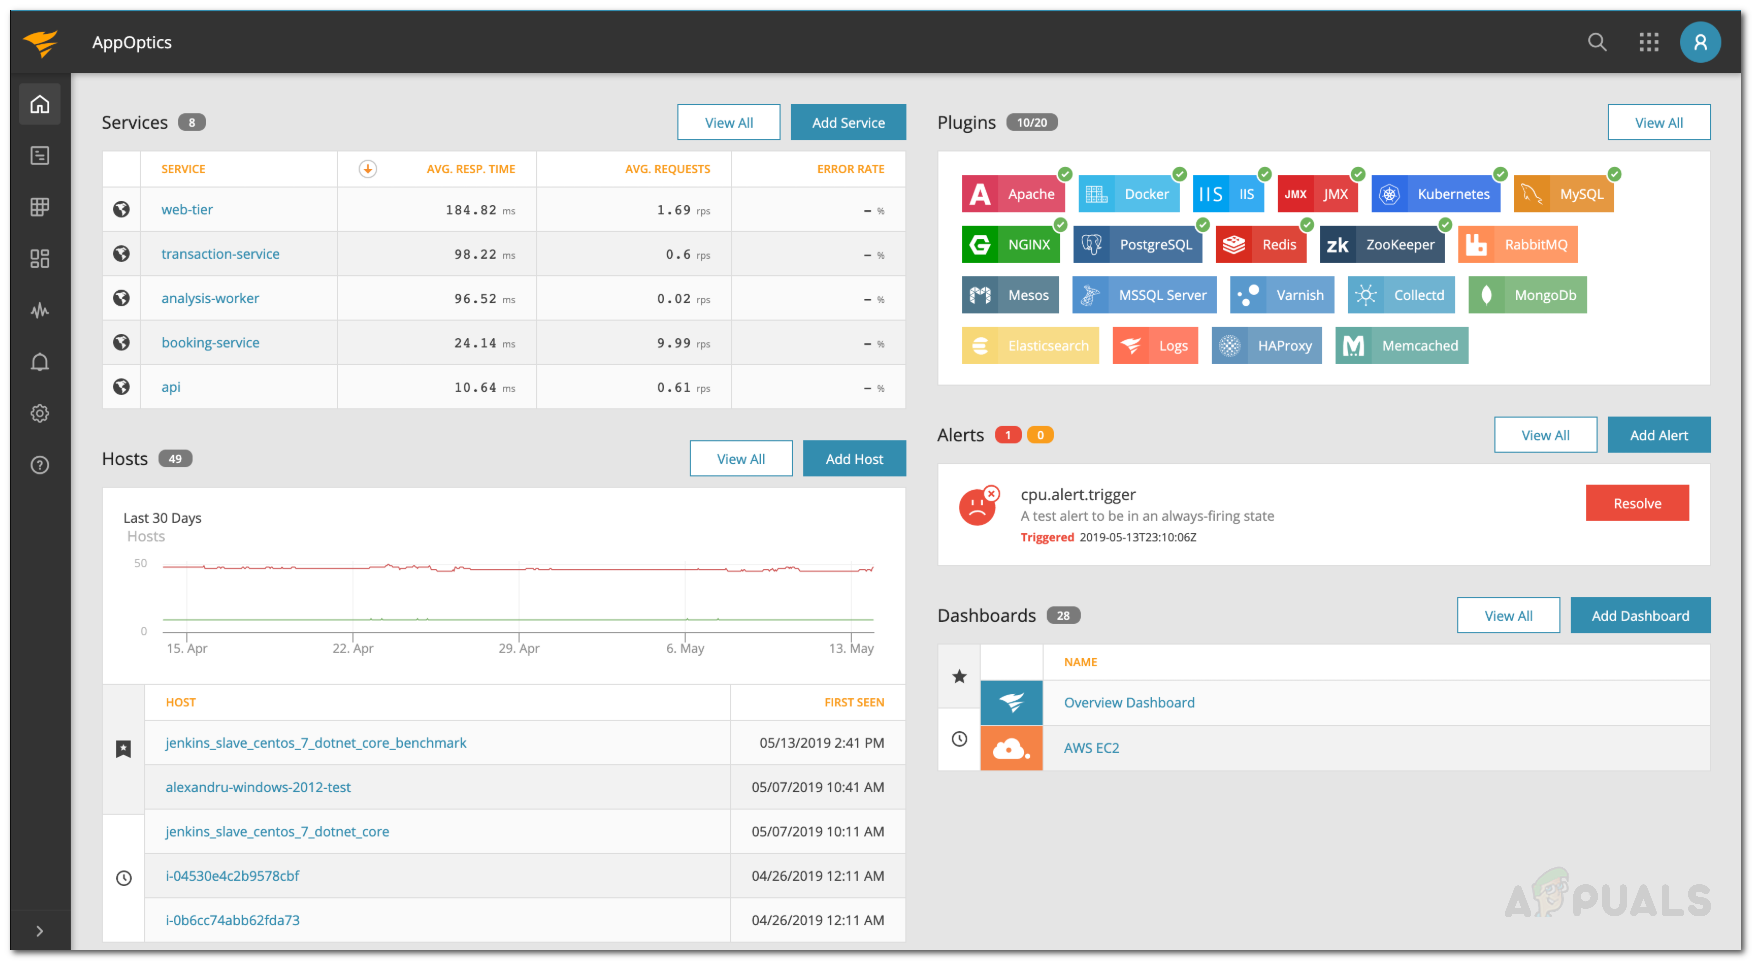
- Once you set up your account, you will be logged in. There, click on the button shown on the homepage to begin the installation phase.
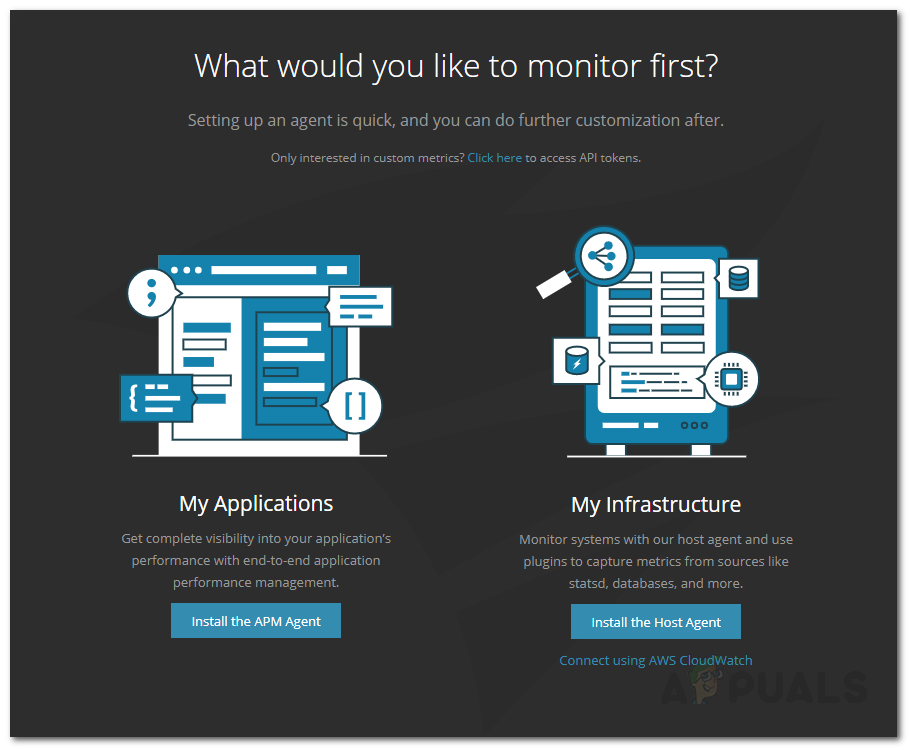
- On the ‘Choose Technologies’ page, click the ‘Install the APM Agent’ button under My Applications.
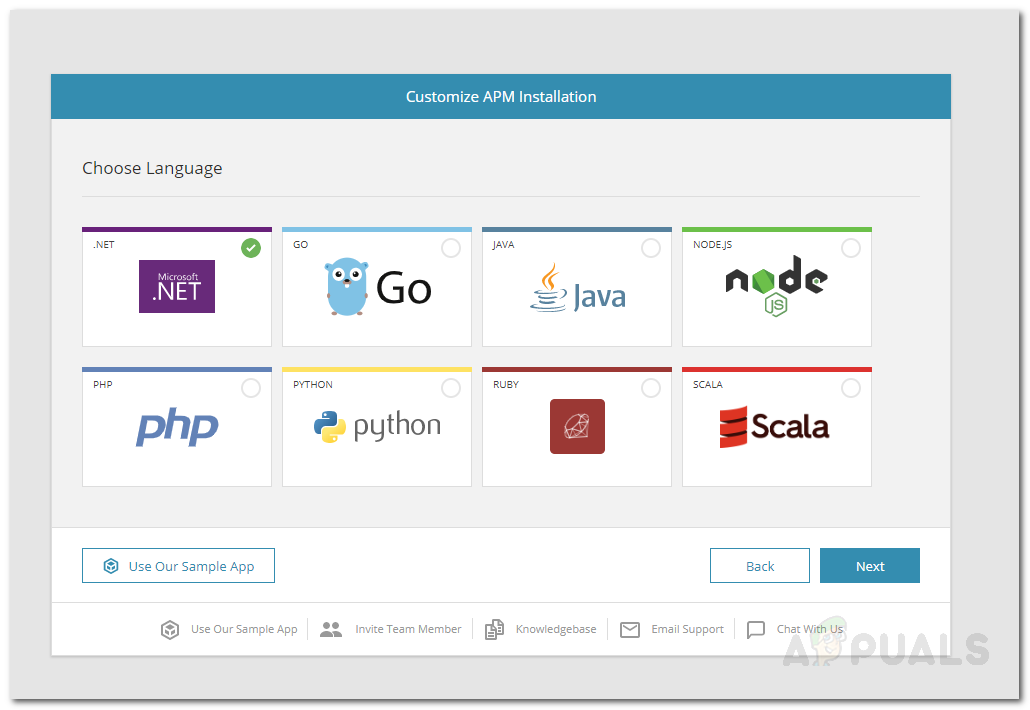
Choosing Technology - Now, you will be asked to choose a language followed by your operating system.
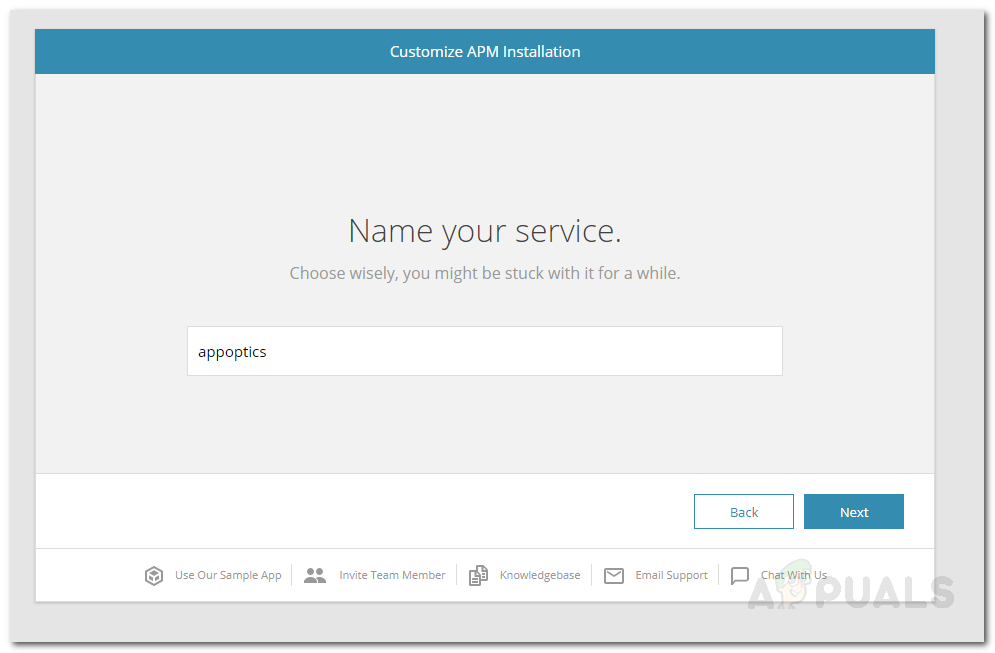
Choosing a Language - After that, give the service to be installed a name and then click Next.
Service Name - Once you have done that, you will be provided with a download link for the agent installer. Download the installer on your system and install it. After that, follow the instructions given.
- When asked, provide the service key and then click Next. Wait for the wizard to finish and then click Finish.
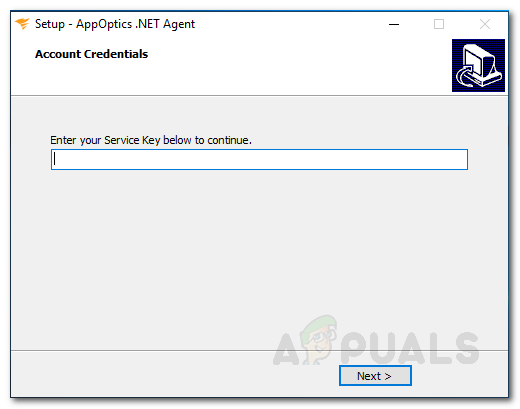
Service Key - To enter the ‘iisreset /restart’ command, open up the command prompt as an administrator and then enter the command.
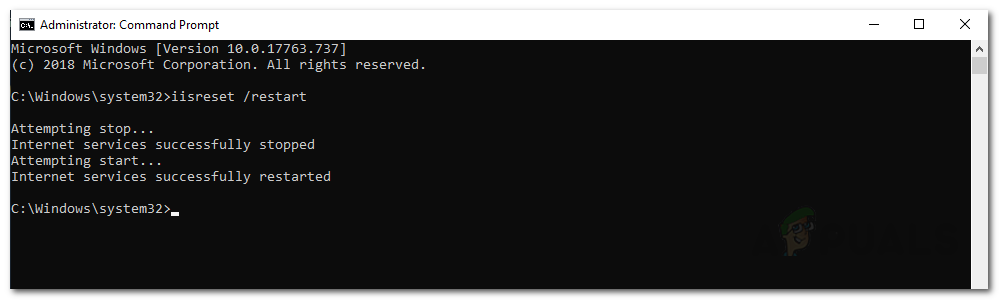
IIS Reset - After that, wait for it to connect and then click Next. Note that it may take a while, sometimes, so be sure to give it some time.
- Finalize the setup and once done, you will be ready to start monitoring the applications.
Alerts
Alerts are one of the most important key features when it comes to monitoring. Fortunately, AppOptics comes with its predefined alerts that will notify you whenever there’s an issue with your applications. For example, if the performance is declining, high load and more. You can also create a custom alert. Here’s how to do this:
- To create a custom alert, click on the Alerts icon from the menu bar will take you to the homepage of alerts. Here, on the top right corner, click on Create Alert.
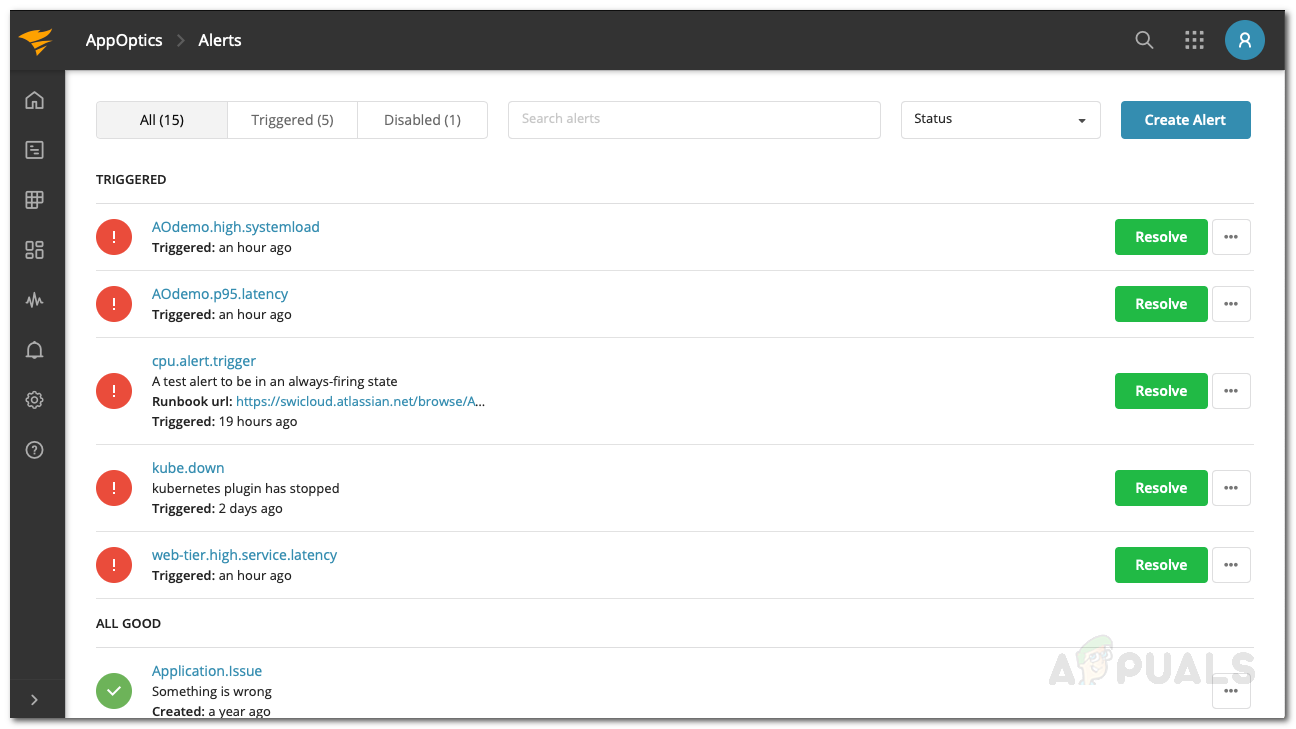
AppOptics Alerts - This will open up a wizard using which you can add in custom alerts.
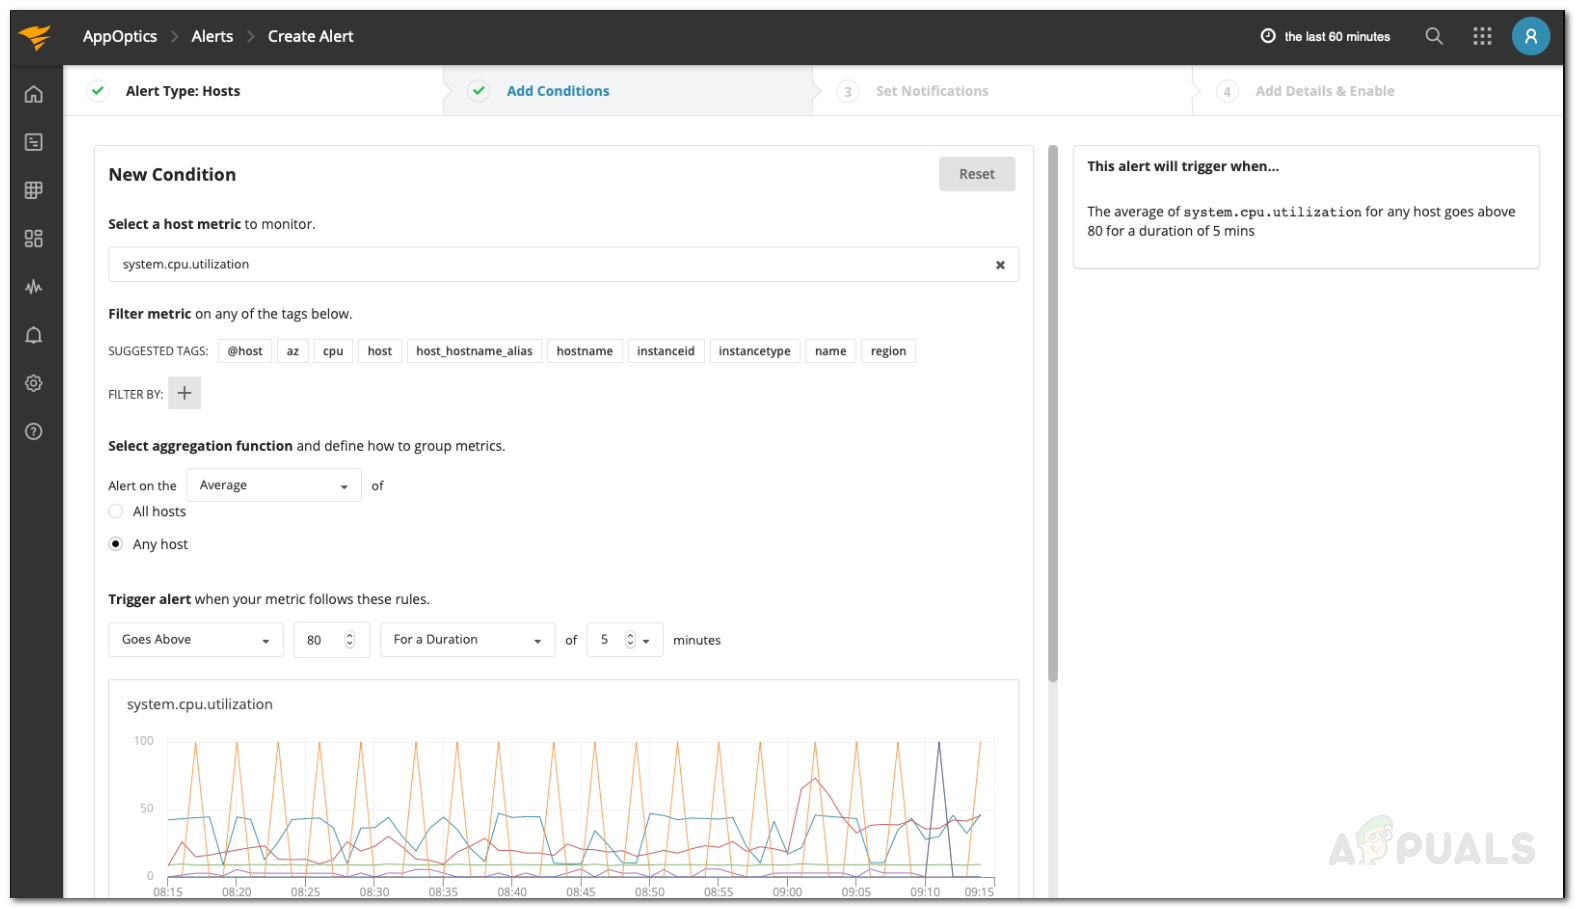
- Choose the type of metric you wish to be alerted on. The Hosts type will let you set an alert for host monitoring. APM, on the other hand, can be used to be alerted about service health metrics.
- Now, on the ‘Add Conditions’ page, fill in the required fields and once done, click Next.
Alert Conditions - Link the alert to any number of notification services you desire on the ‘Set Notifications’ page. To do that, just click on any notification service and select one of the options from the drop-down menu. Then, click Next.
- After that, add details about the alert on the ‘Add Details and Enable’ page. Once done, click the Enable button on the bottom-right corner to enable the alert.
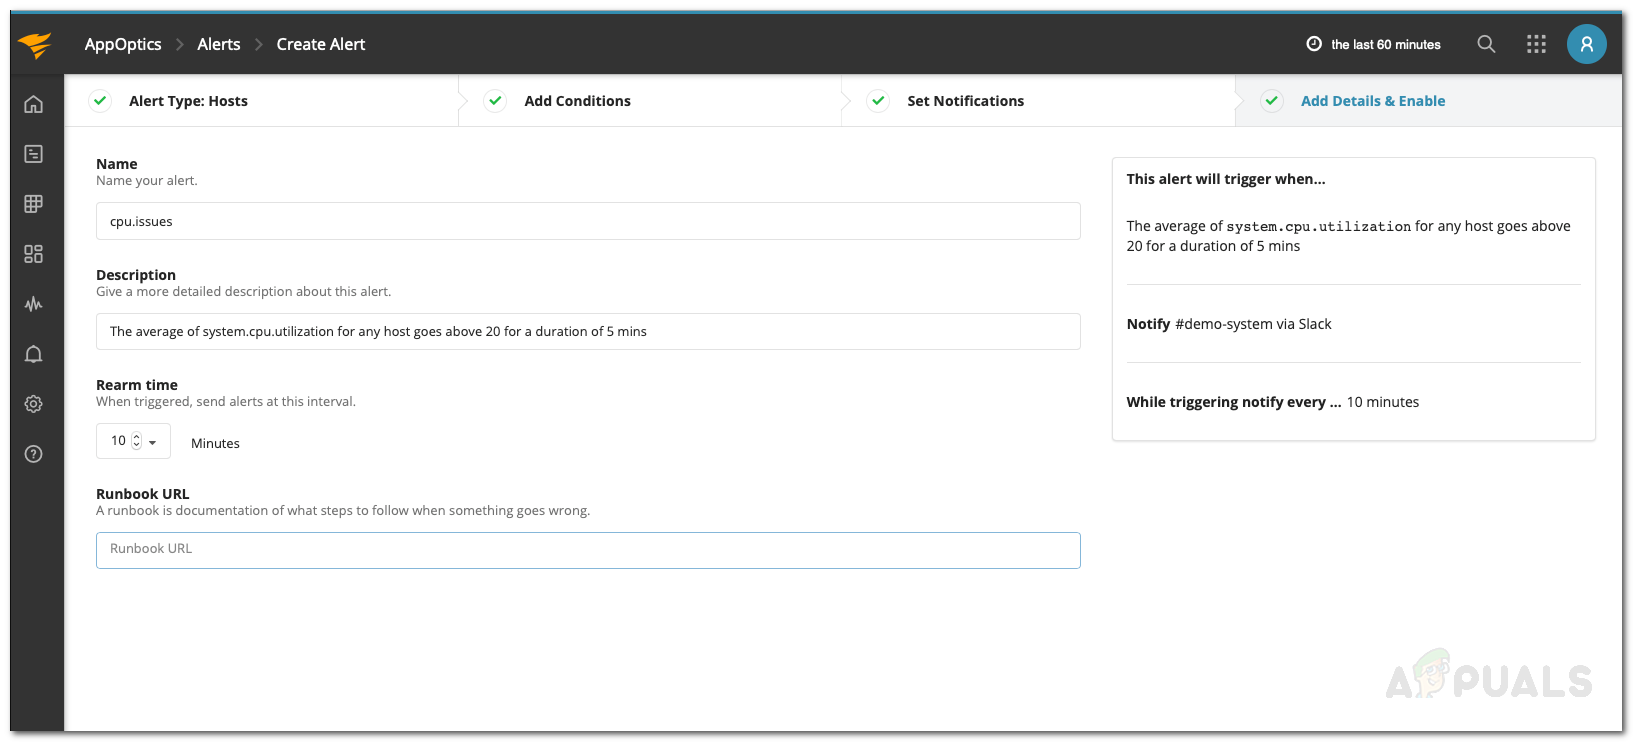
Alert Details - The alert will be added successfully.