How to Create Advanced Reports For Network Devices Using Solarwinds?
Detailed Solwarinds Network Reporting Guide!
Solarwinds Orion is packed with an advanced reporting feature that allows System Administrators to build advanced custom reports for their executive reviews and to check the historical data in a device(s) or parameters monitored on the device(s). Also, we can automate these reports to receive whenever required to a set of recipients.
Solarwinds includes various predefined reports for performance, availability, usage, historical metrics, etc. We can use them or create customized reports to fulfill the requirement. Reports can be extracted from Solarwinds in multiple formats like data, charts, gauges, etc. To learn more about Solarwinds reports and download them, click on this link.
With that being said, let’s get started and see how to create reports and schedule the reports to deliver automatically to a set of recipients using Solarwinds.
Creating Reports Using Solarwinds
In this demo, we will see how to make the below reports.
- Availability Report for Network Devices
- CPU and Memory Utilization Chart Report for Servers
- Interface Bandwidth Utilization Report – Data
- Interface Bandwidth Utilization Report – Chart
1. Availability Report for Network Devices
We can use availability reports to check how much percentage of a device or set of devices are available at a specific time interval. Follow the below steps to create the availability report.
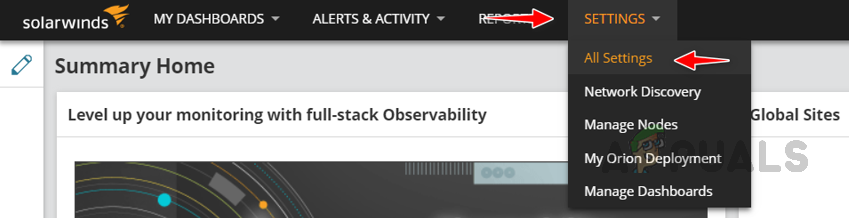
- Go to Settings and click on All Settings.
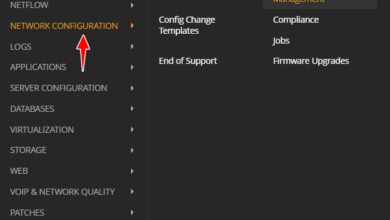
- Click on Manage Reports under Alerts & Reports.

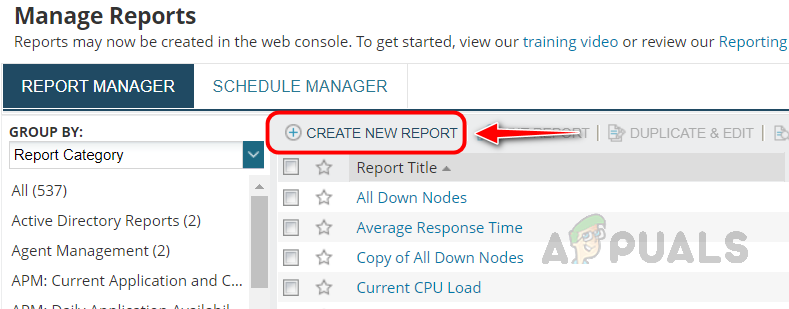
- Click on Create New Report.
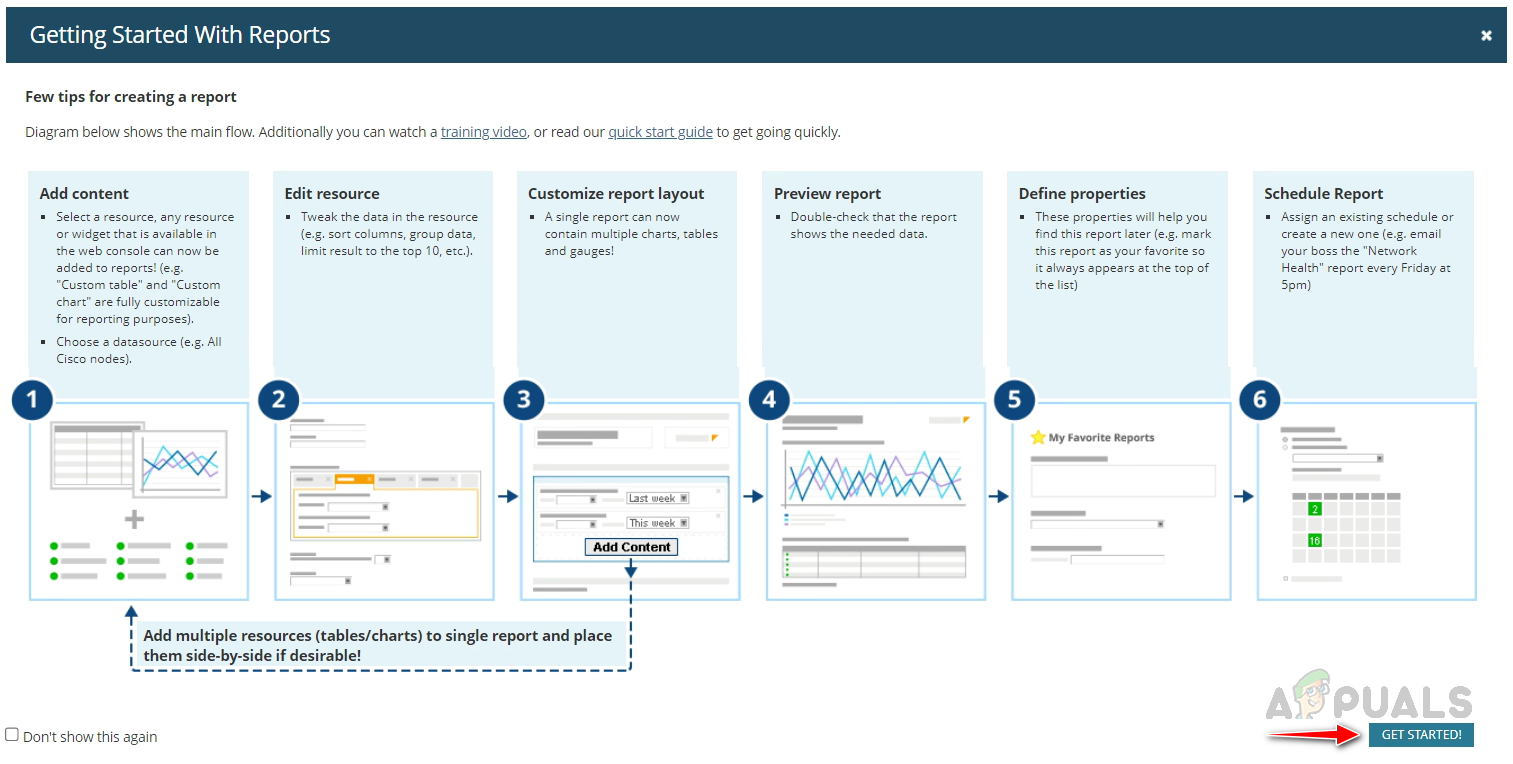
- Click on Get Started in the Getting Started With Reports prompt.
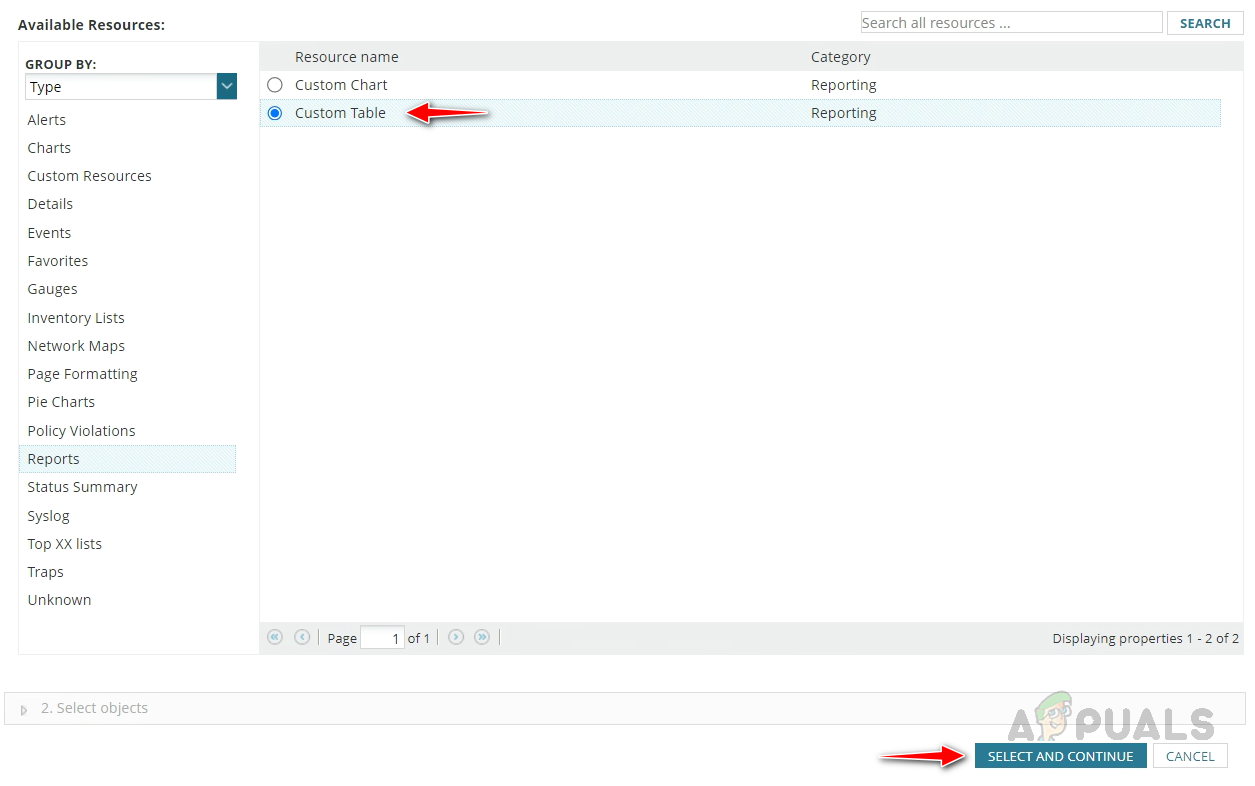
- Select Custom Table from the resources and click on Select and Continue.
- Select Dynamic Query Builder in Selection Method and select Advanced Selector. Query builder is easy to use, and Advanced Selector gives more flexibility in building the report.
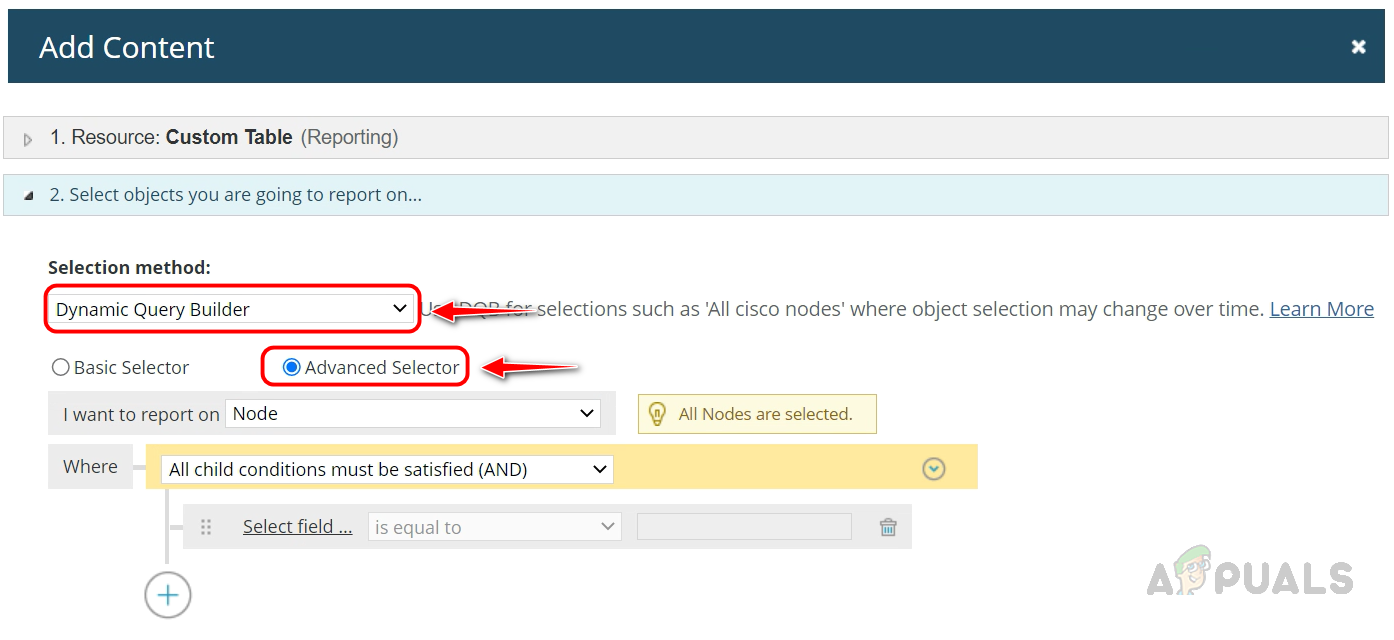
- Select Node in I want to report on field since we will create reports on the availability of nodes (devices).
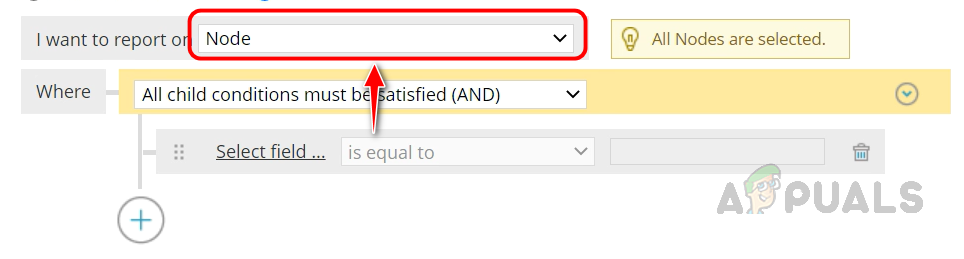
- By default, all the nodes are selected for the reports. Let’s filter only network devices for this report.
- Click on the Select field in the query builder.
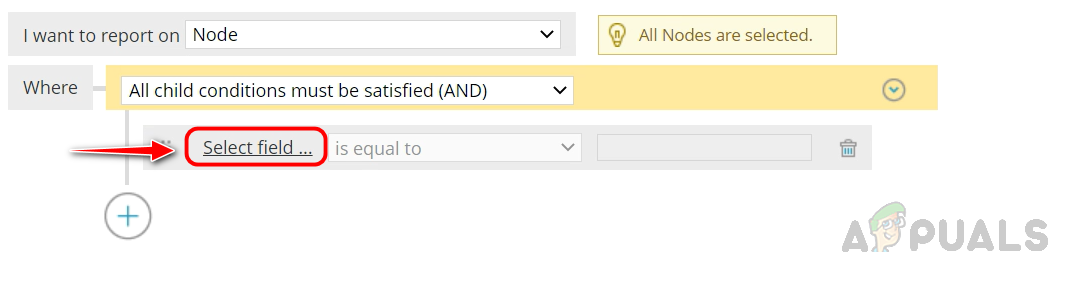
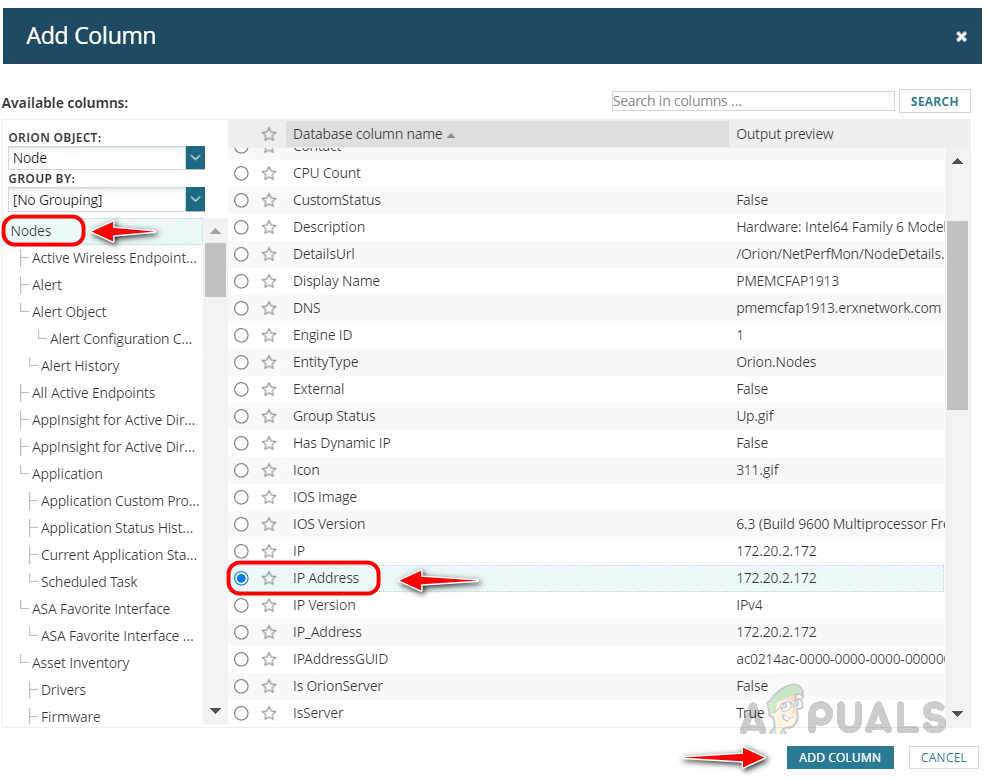
- Once click on the Select field, Add Column prompt will appear. Here we must choose the columns we will use to filter the required nodes from all nodes.
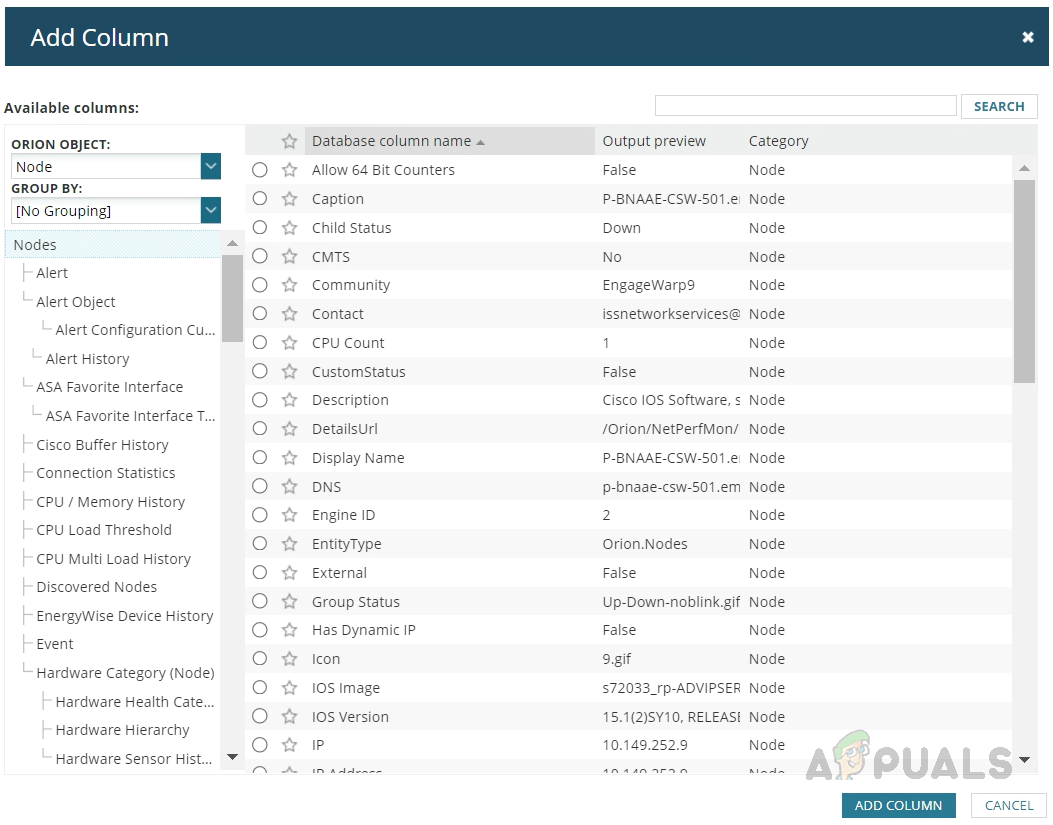
- Since we are going to report on network devices availability, select Nodes in the object section and select the required columns in the column section on the right-hand side. Here we will use the Vendor column to filter specific vendor devices. Then click on Add Column.
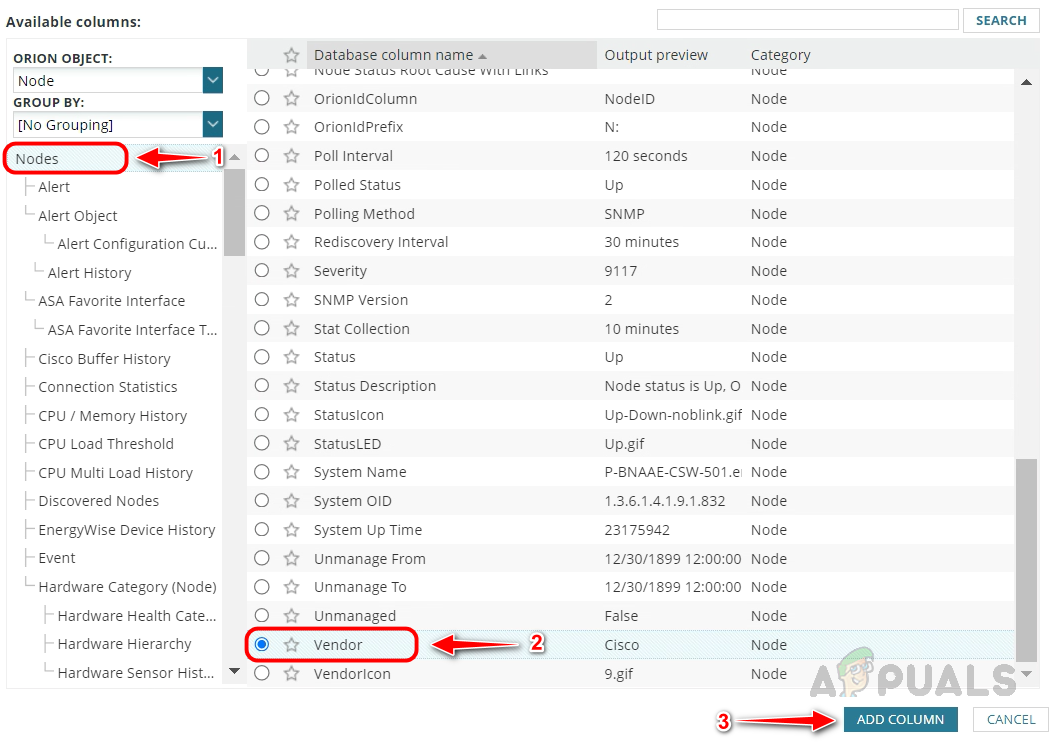
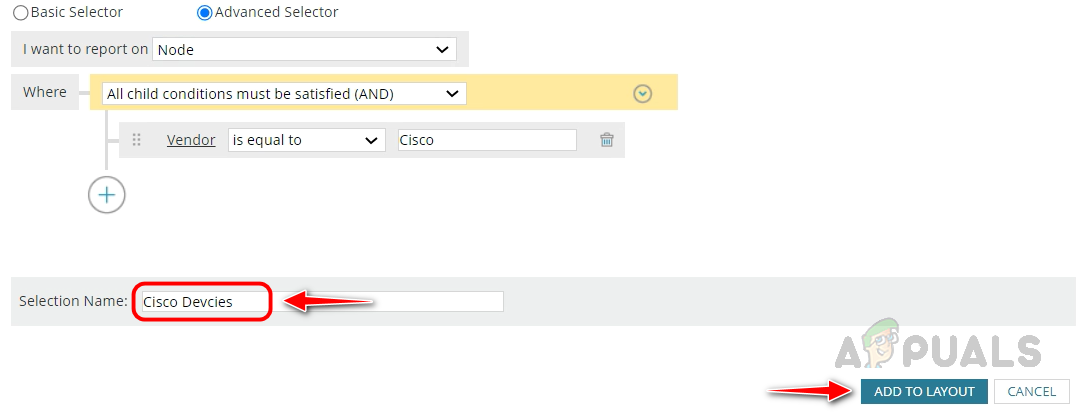
- Provide the Vendor name that you want to filter.
 Here we are filtering Cisco devices for this report.
 - Once built the query, provide a name for this selection and click on Add to Layout.
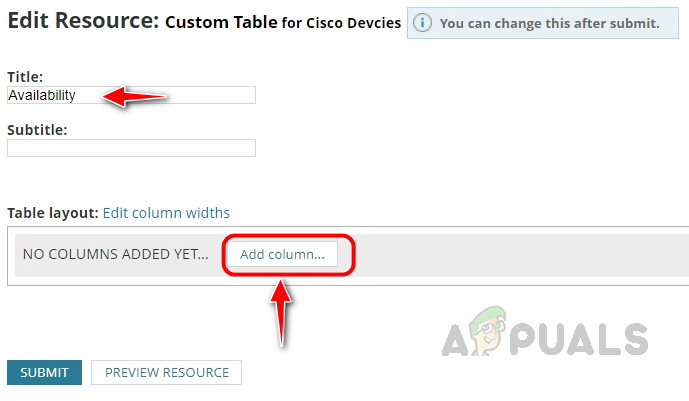
- Once click on Add to Layout, Solarwinds will automatically take us to the Edit Resource page, where we add the columns we want in the report.
- Provide an appropriate name in the Title text box. Now click on Add Column to add our columns for the report.
- Since we are creating an availability report for network devices, we need the device name, IP address, timestamp, and Percent available columns in the report. We can add other columns if required.
- We can get the device name and IP address in the Nodes table. Select the Nodes table and then select Node Name and IP Address.
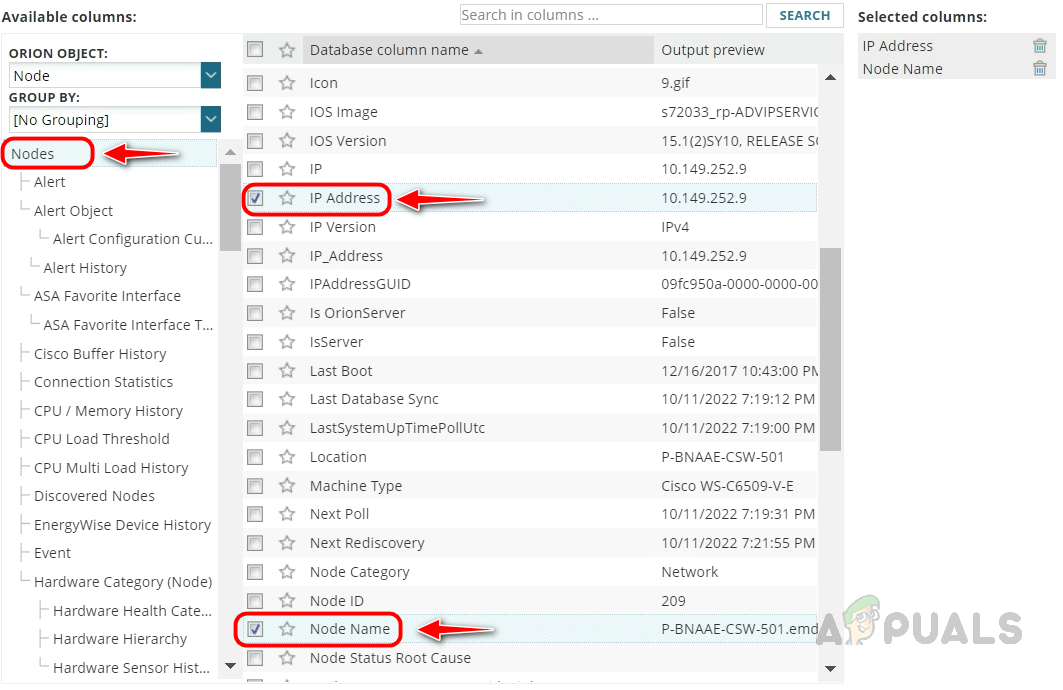
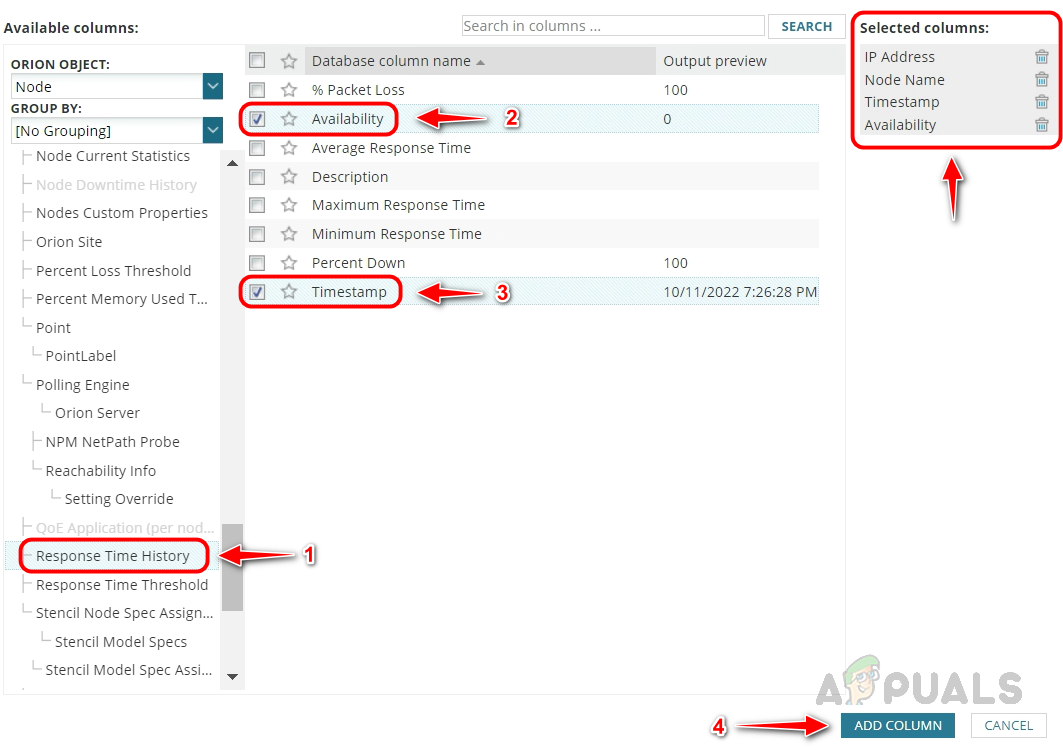
- To add timestamp and percent available columns. Scroll down on the table section, select Response Time History, and then select the Availability and Timestamp columns. We can see all the columns chosen for this report on the right-hand side. Once all the required columns are selected, click on Add Column.
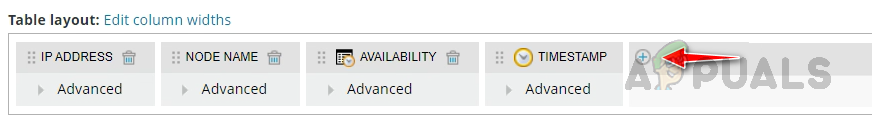
- We can see the selected columns in the Table Layout. If you want to add more columns, click on the + icon. We can rearrange the columns by dragging and dropping.
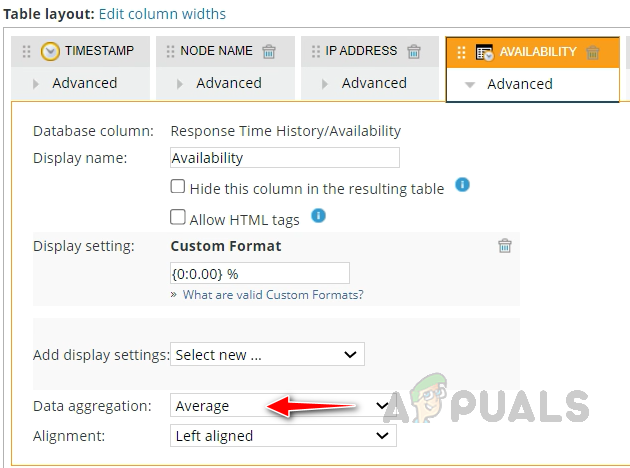
- Click on the Advanced option available in the columns to customize the column name and display settings. Let’s rename the display name of the column timestamp to Month.
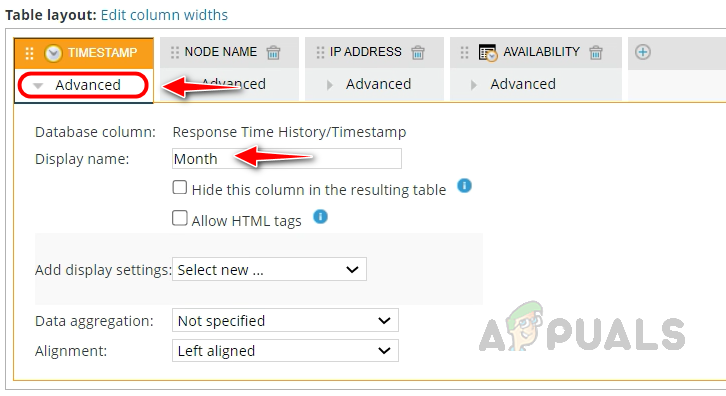
- In the availability column, ensure the Average is selected in the Data Aggregation field.
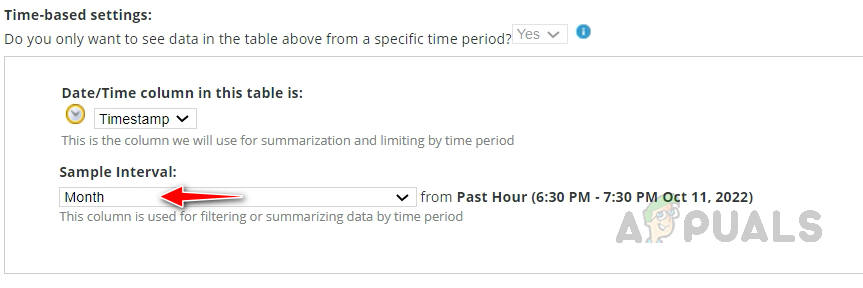
- In the time-based settings, select Month in the Sample Interval field since we create a monthly availability report for network devices.
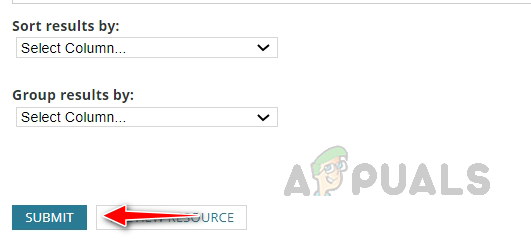
- If you would like to sort/group the report output based on any of the columns, use the sort option. Once done, click on submit.
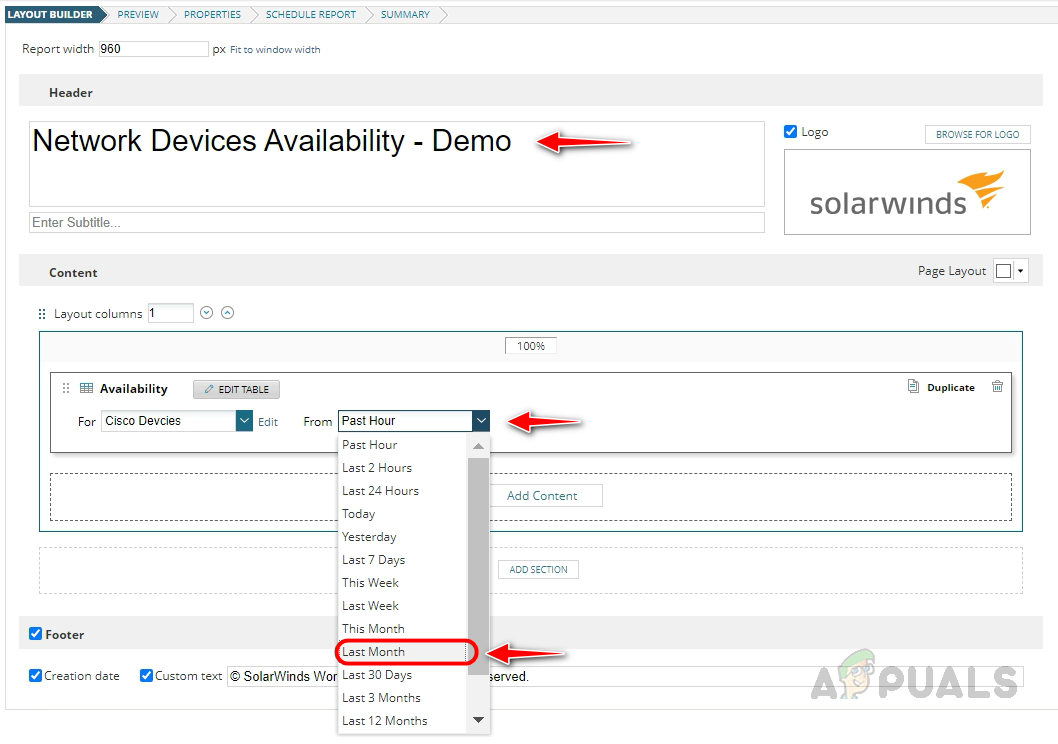
- Now, we will be redirected to the layout builder page. Provide an appropriate name for the report. Select Last Month in the From field. This is where we choose the report time interval. We can use the preset intervals or
the custom interval option in the drop-down list. Once done, click on Next.
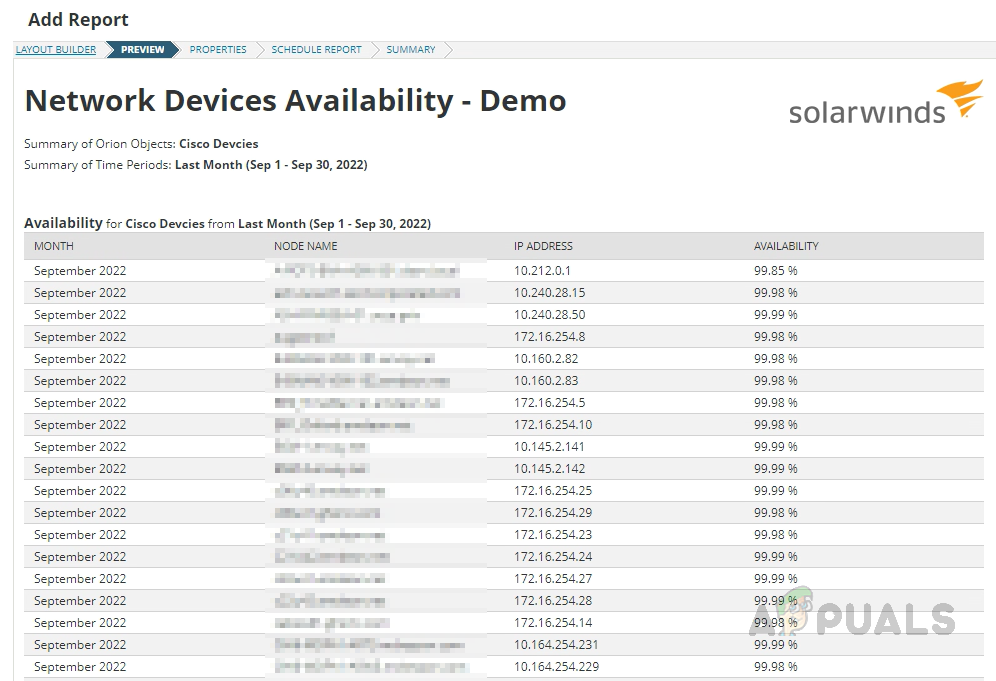
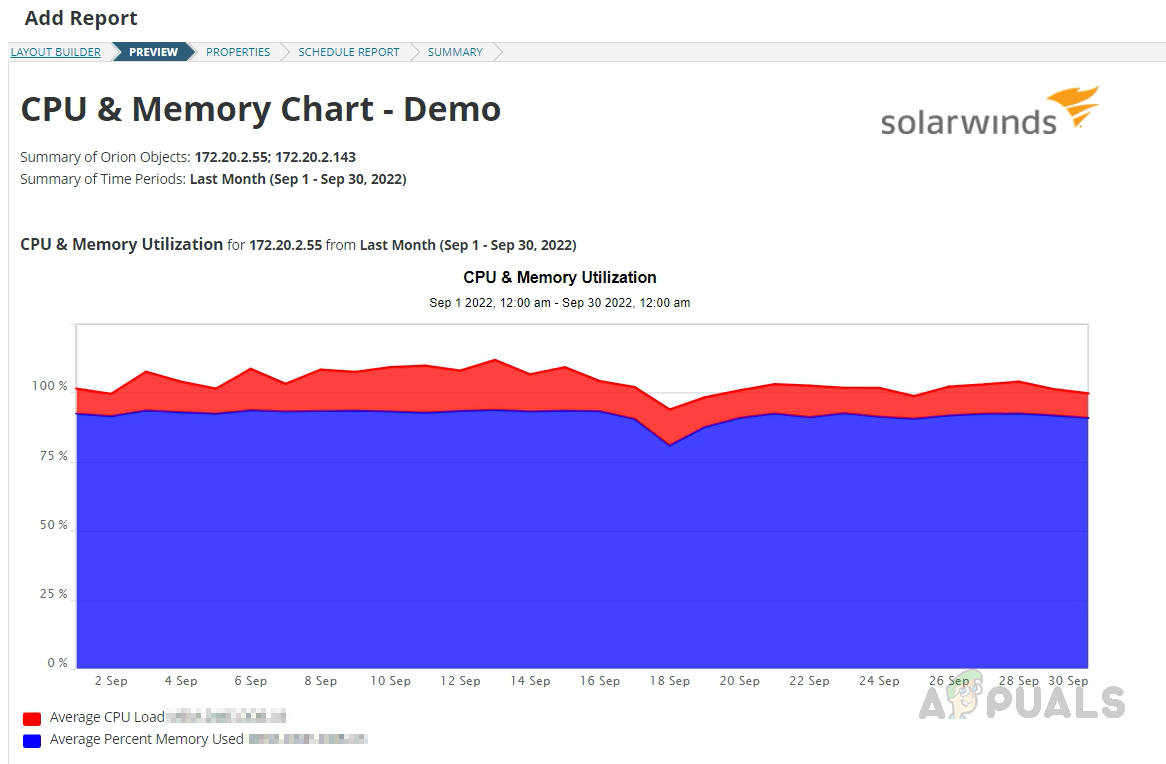
- We can see a preview of the report output on the Preview page. Validate whether the report output is the same as we expected, and click on Next.
- Click on Next in the Properties and Schedule Report pages.
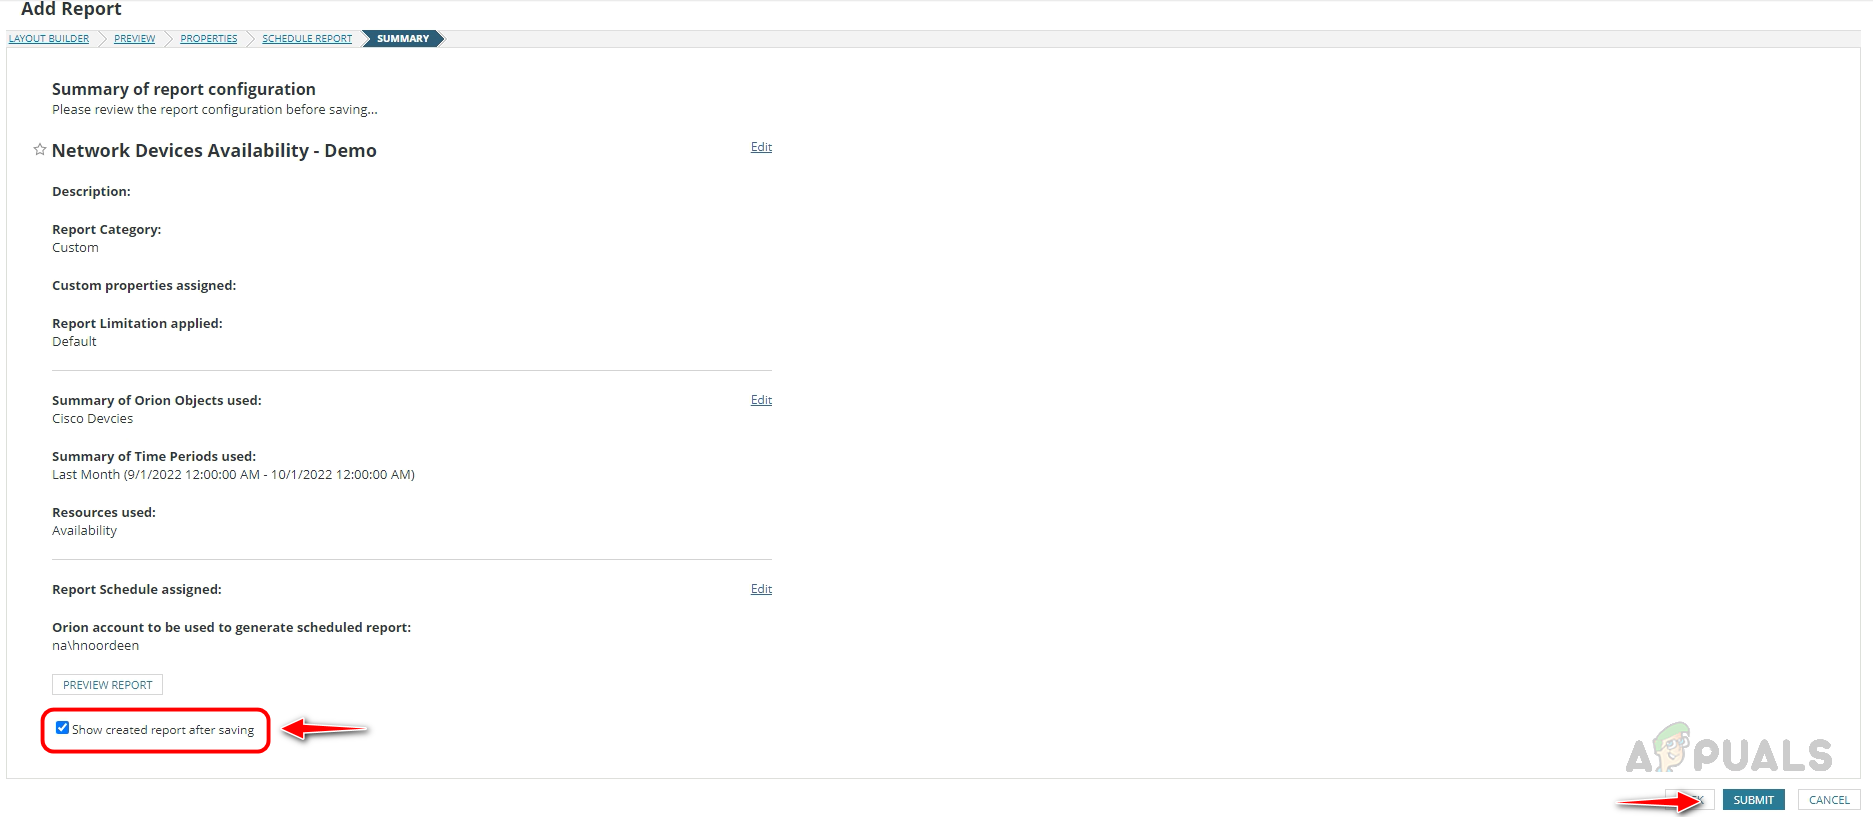
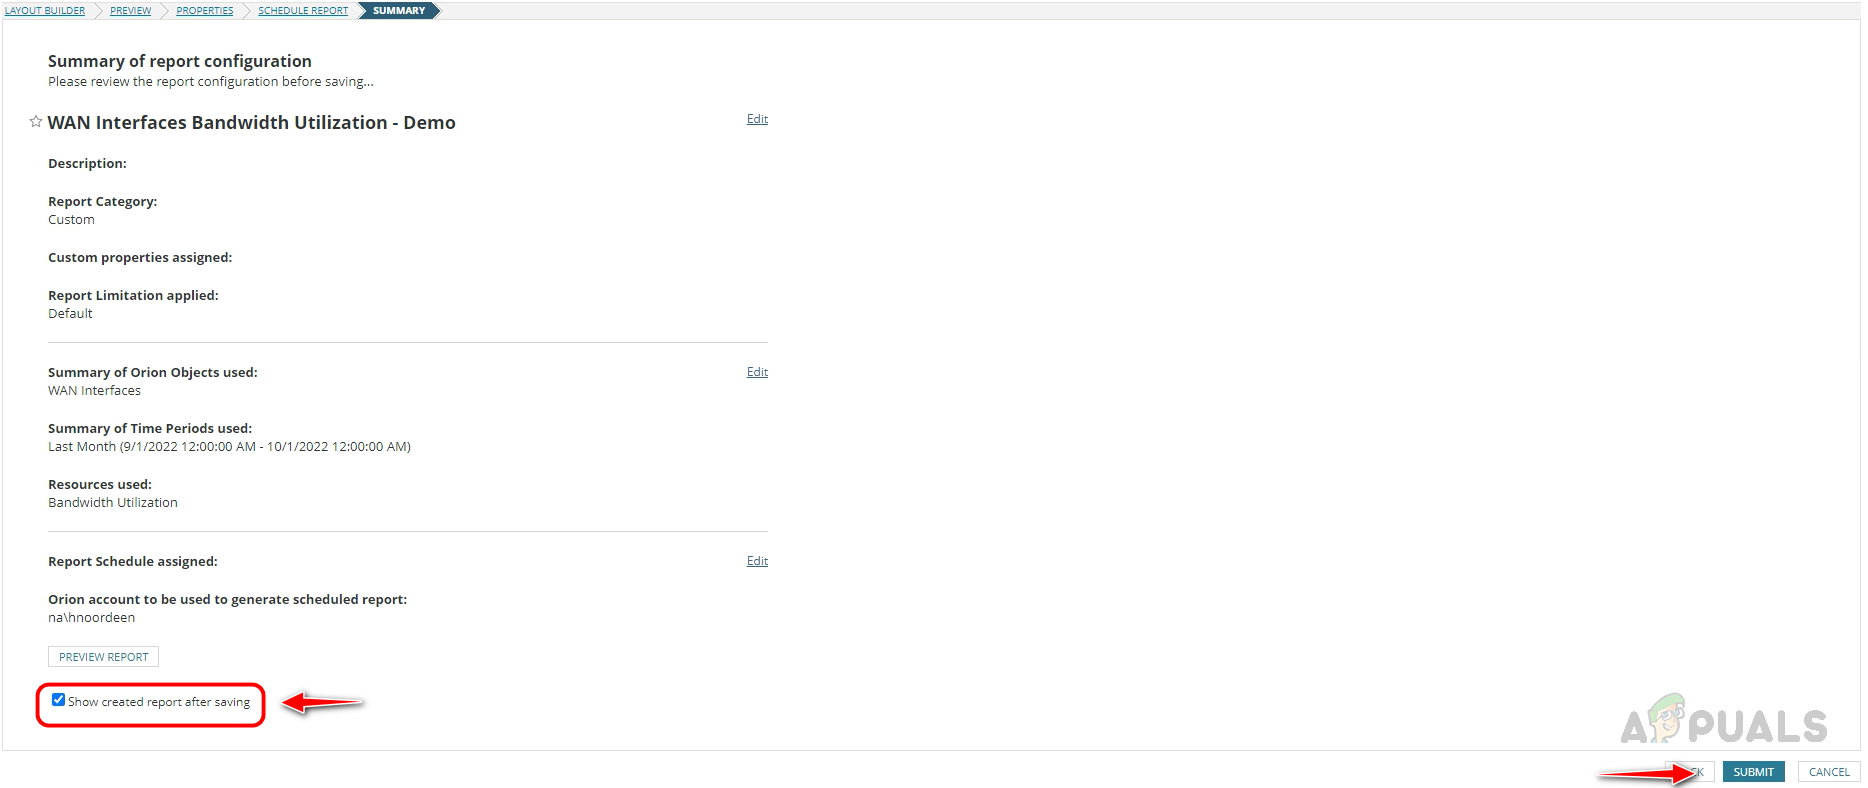
- On Summary Page, check Show created report after saving to view the created report and click on Submit.
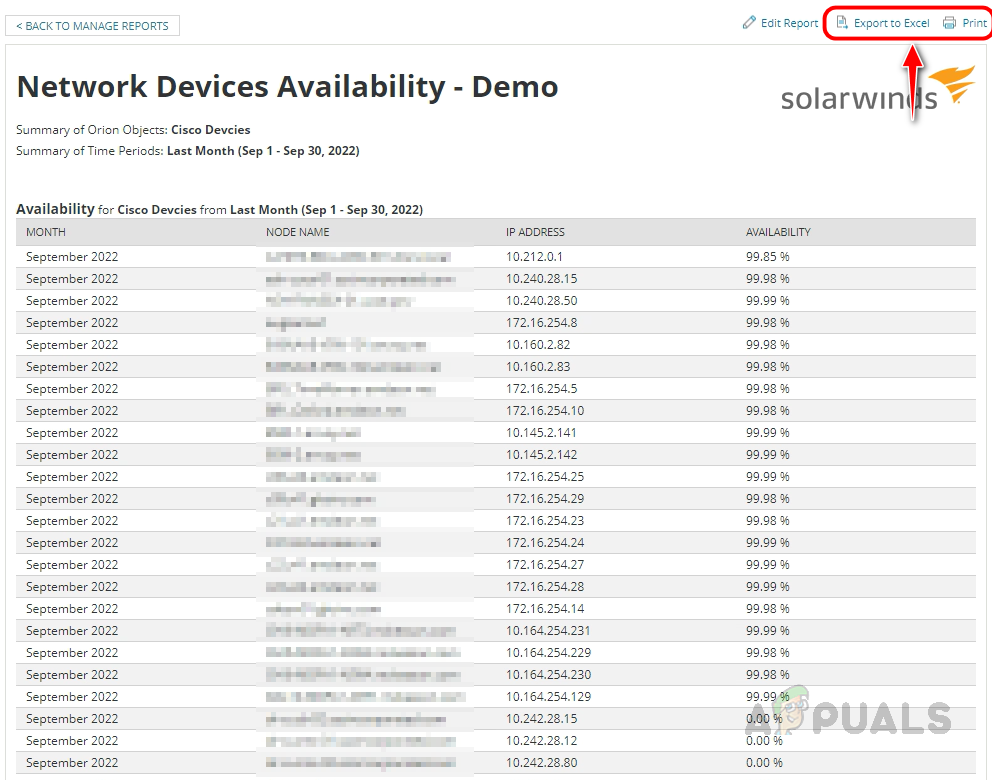
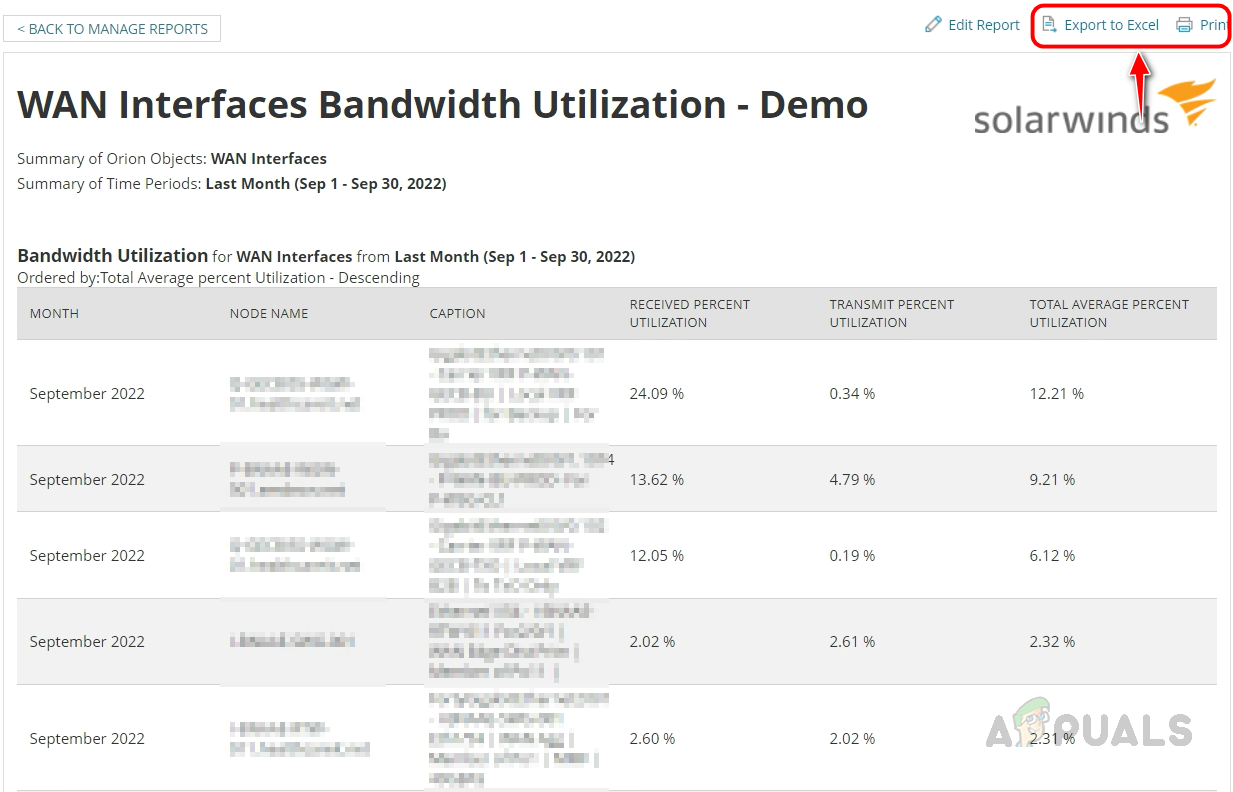
- We can see the created report now. We can download the report in excel format or print the report by clicking on Export to Excel or Print.
This is how we can create an availability report for any devices monitored through Solarwinds. We can create an availability report for any parameter monitored in Solarwinds. All we need is to choose the proper object and its columns.
2. CPU and Memory Utilization Chart Report for Servers
Follow the below steps to create a chart report for CPU and Memory utilization.
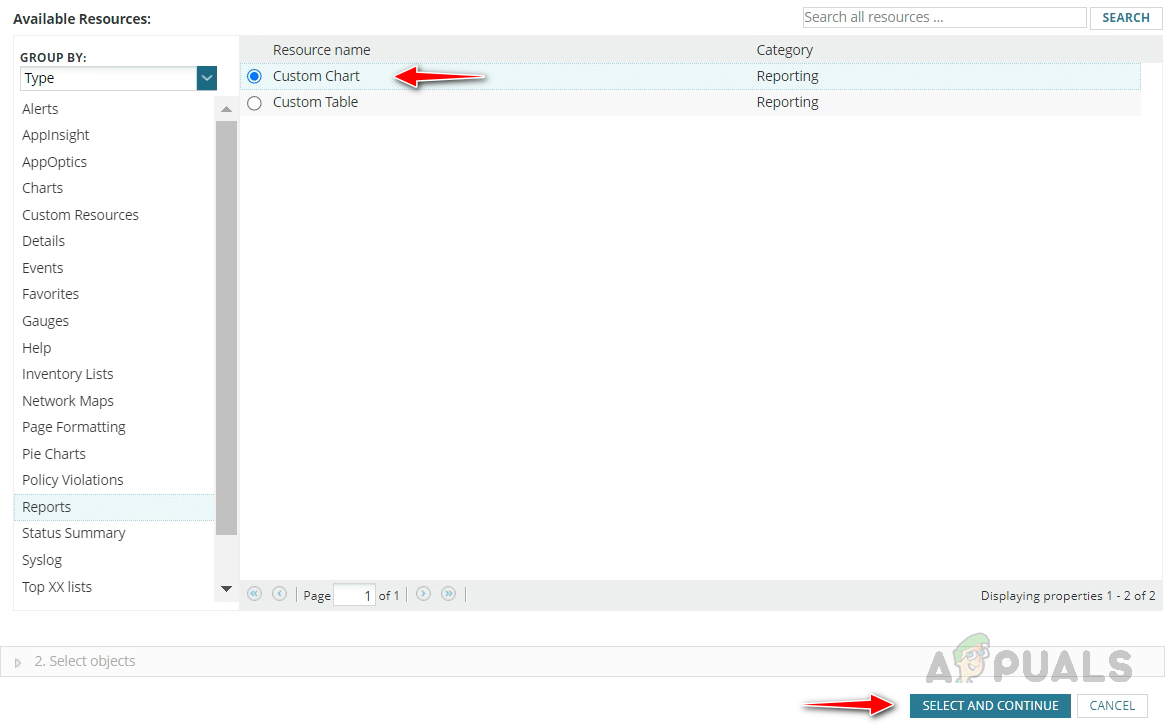
- Follow steps 1 to 4 from the above demo and while selecting resource on the 5th step, choose Custom Chart and click on Select and Continue.
- We need to create a separate layout for each device in chart format reports. If we use a single layout, then the utilization graphs for the nodes will be placed in the same graph, and it will be difficult for us to understand the report.
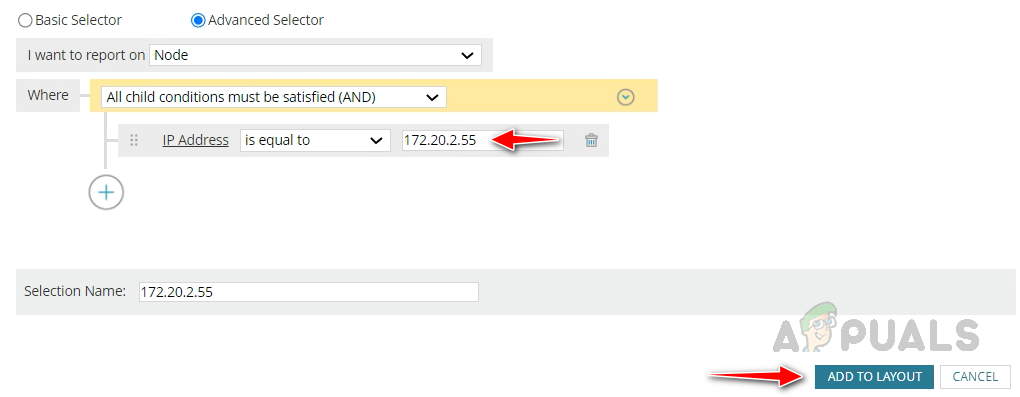
- So in the query builder section, select a single device using the columns name or IP address.
- Here I am using the IP address column filter the server. Select the IP address column from the Node table and click Add Column.
- Provide the IP Address and click on Add to Layout.
- Now Solarwinds will redirect us to the resource page, where we need to configure the layout for the chart.
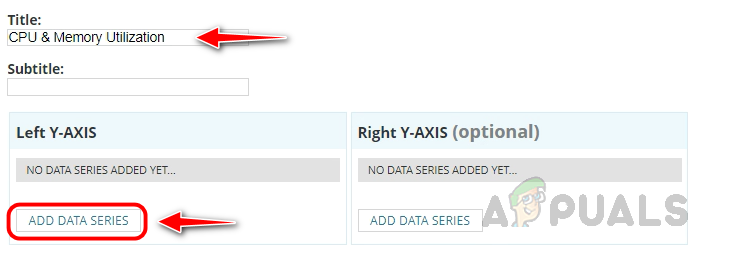
- Provide an appropriate name for the chart and click on Add Data Series in the Left Y-AXIS section.
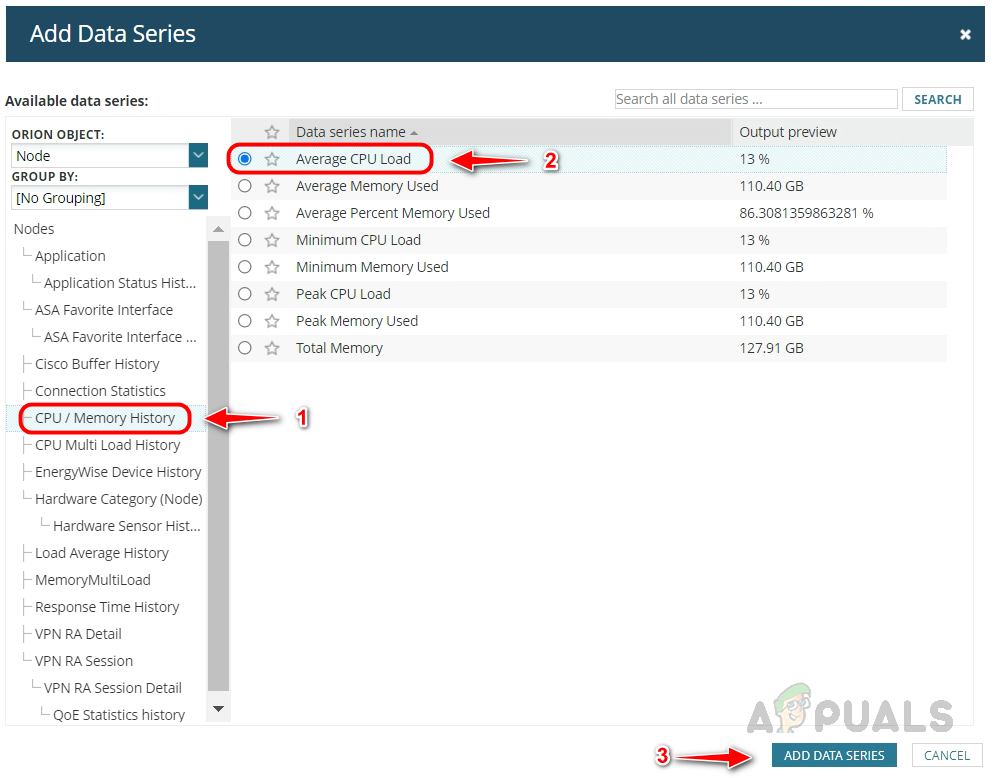
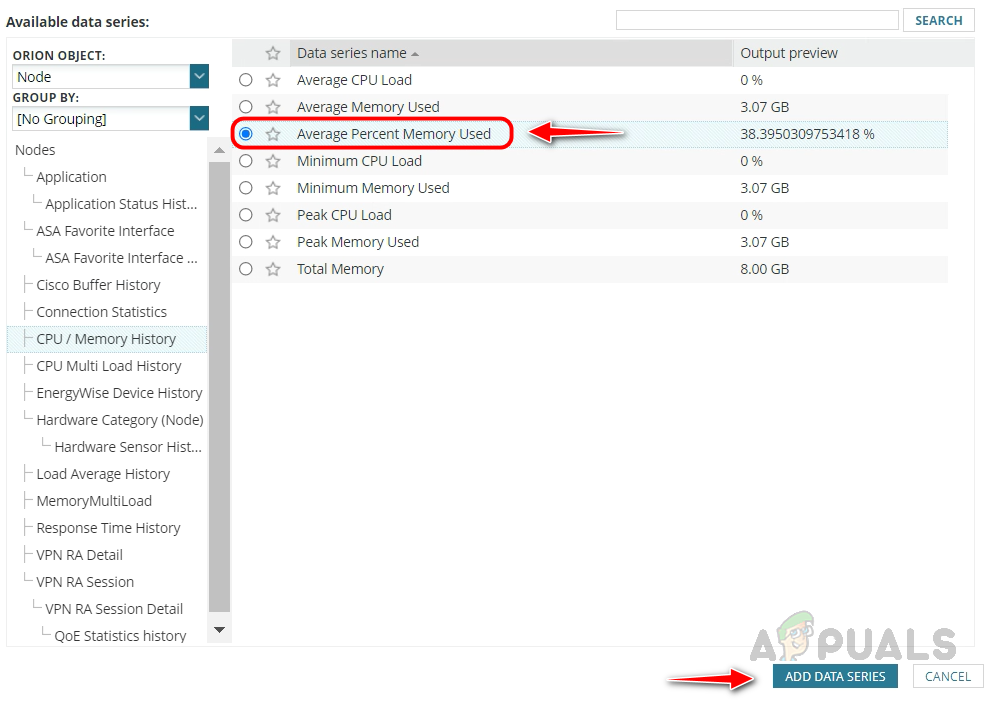
- In the Add Data Series prompt, select the CPU/Memory History table in the left pane, select Average CPU Load in columns, and click Add Data Series.
- To add the Memory column to the graph, repeat steps 7 and 8, select the Average Percent Memory Used column and click on Add Data Series.
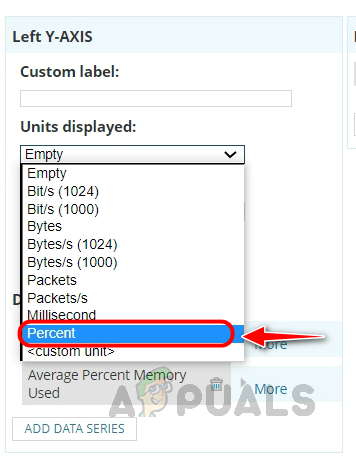
- Now let’s configure the graph settings. Select the Percent in the Unit displayed field.
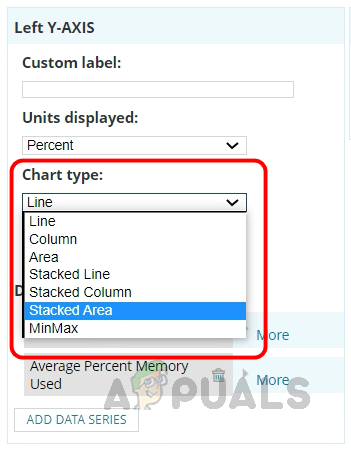
- Solarwinds provides different types of charts. Choose your preferred option from the Chart Type list.
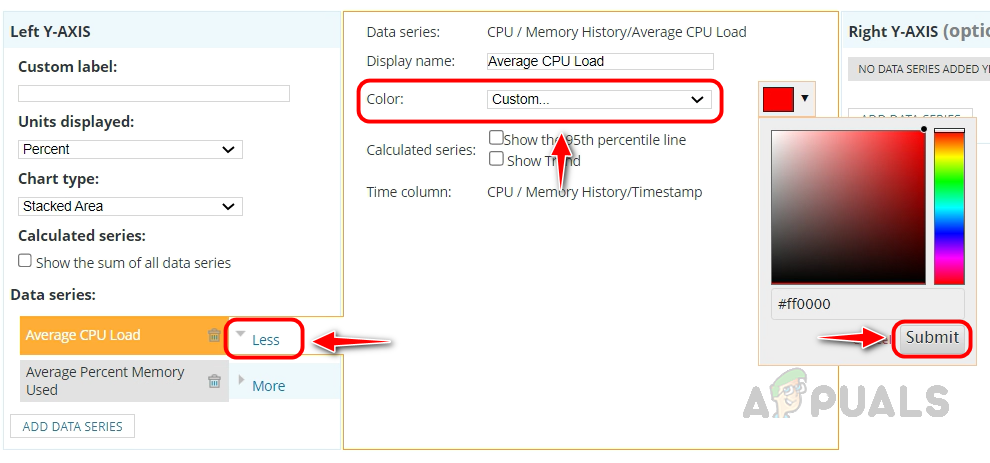
- We can customize the column details as well. Click on more next to the column you want to customize. I am changing the default color and using a custom color in this example. Choose the preferred color and click on submit.
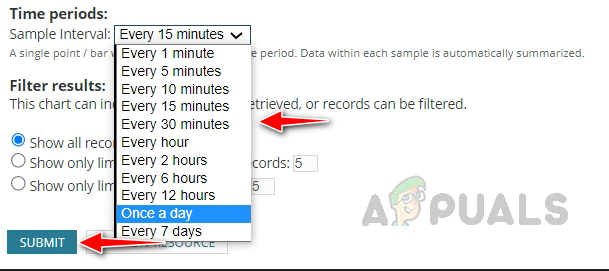
- In the Time Period field, choose the preferred time interval you need in the graph scale. You can choose the interval based on the report duration. I am creating this report for last Month, choosing Once a day. Click on Submit to save the changes.
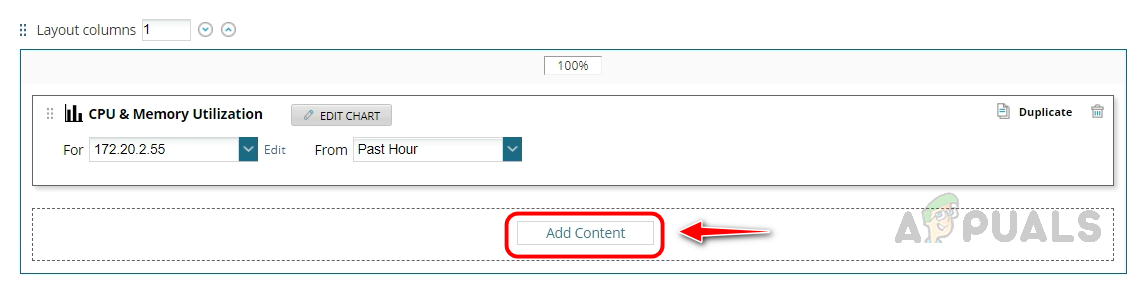
- To add another server to the report, click Add Content.
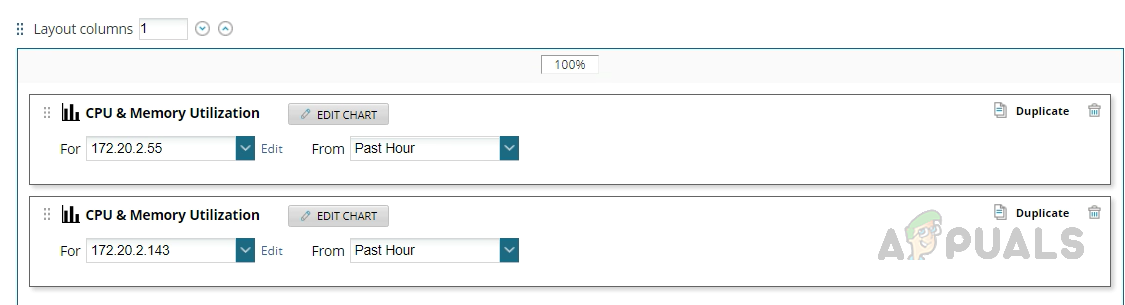
- Follow steps 1 to 13 to configure the layout. I have added one more server to the report for this demo. You can add more servers to the report based on the requirement.
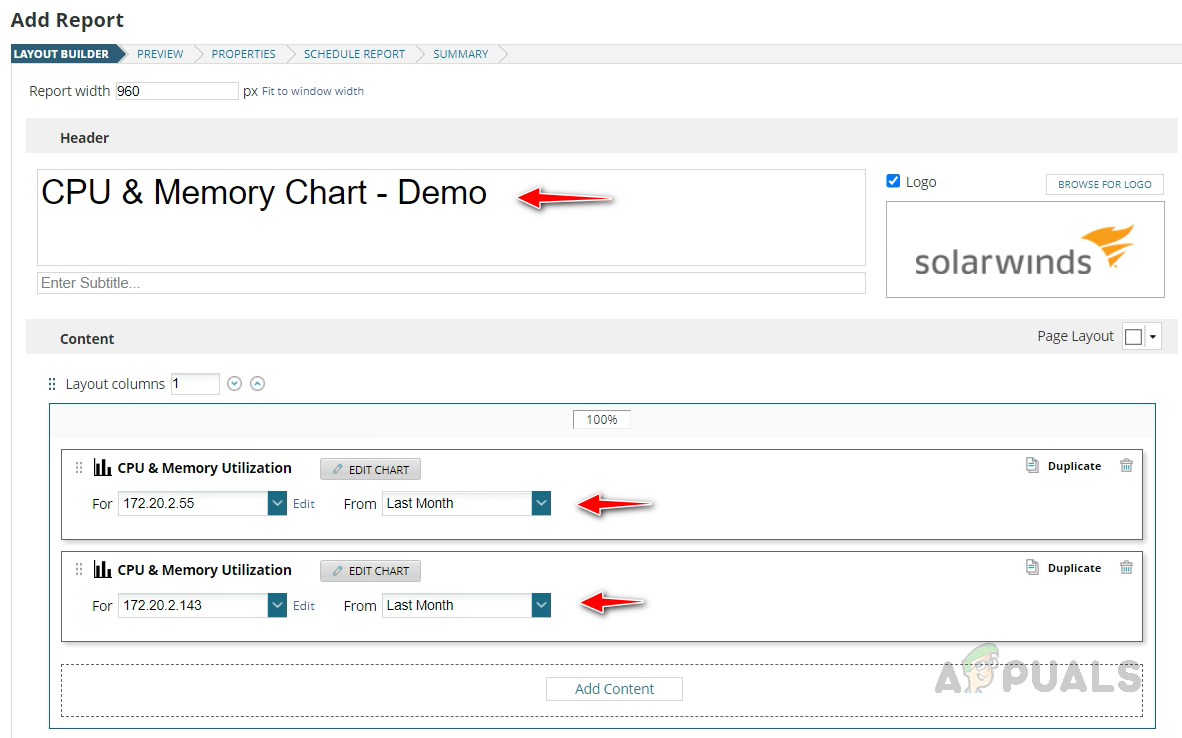
- Provide an appropriate name for the report, choose the report’s duration, and click on Next.
- A preview of the report will be shown. Click on Next.
- Click on Next in the Properties and Schedule Report pages.
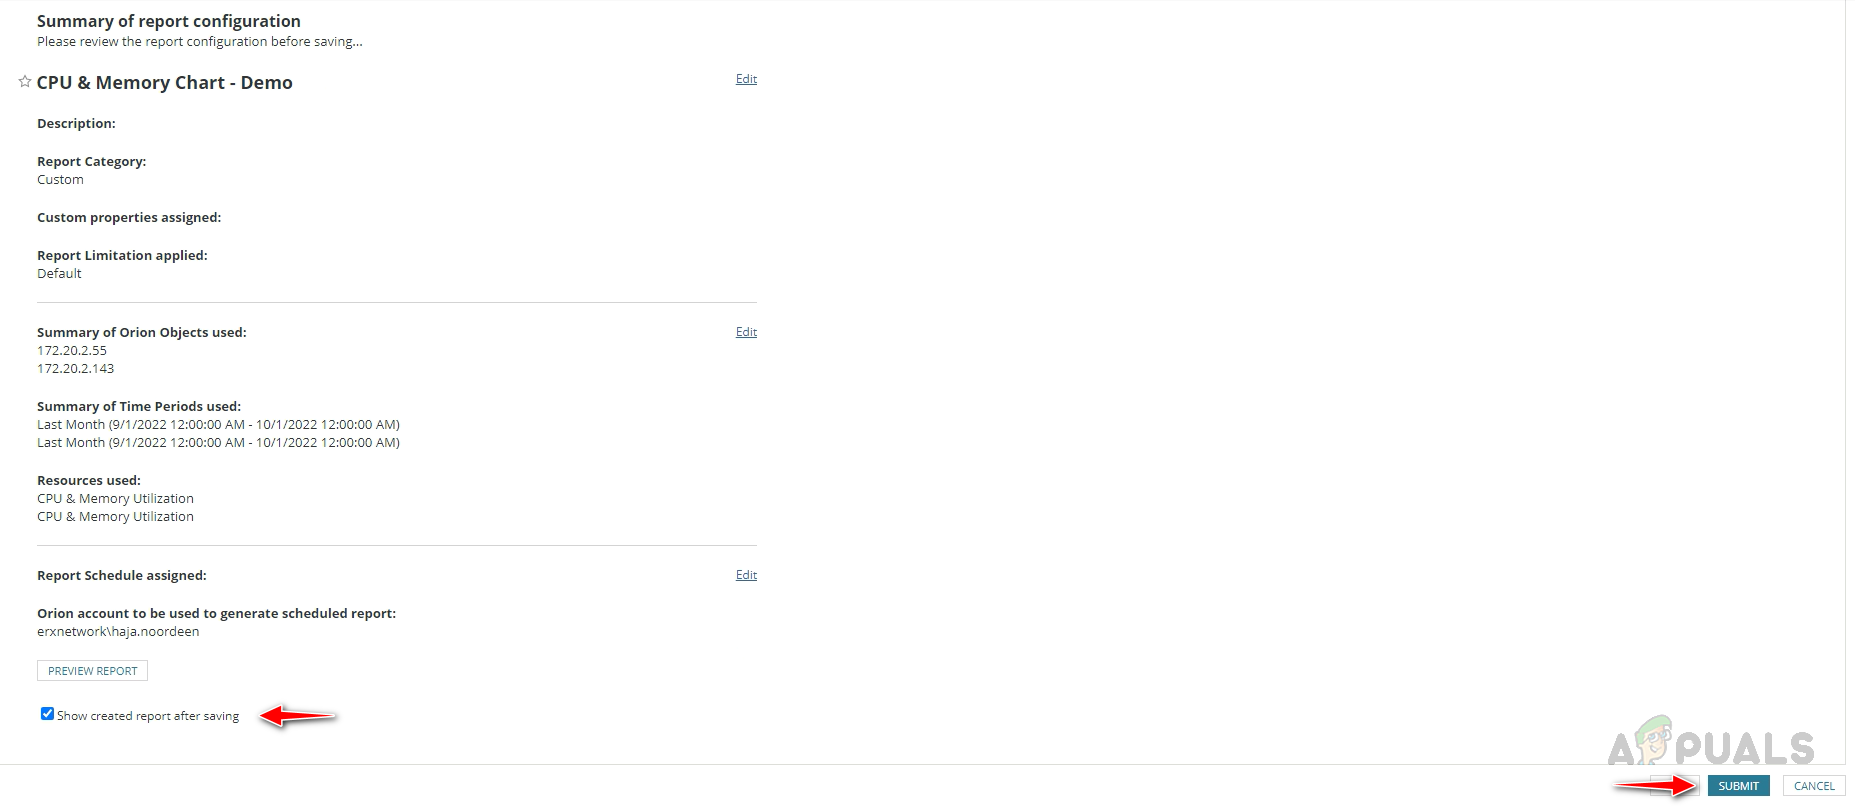
- On Summary Page, check Show created report after saving to view the created report and click on Submit.
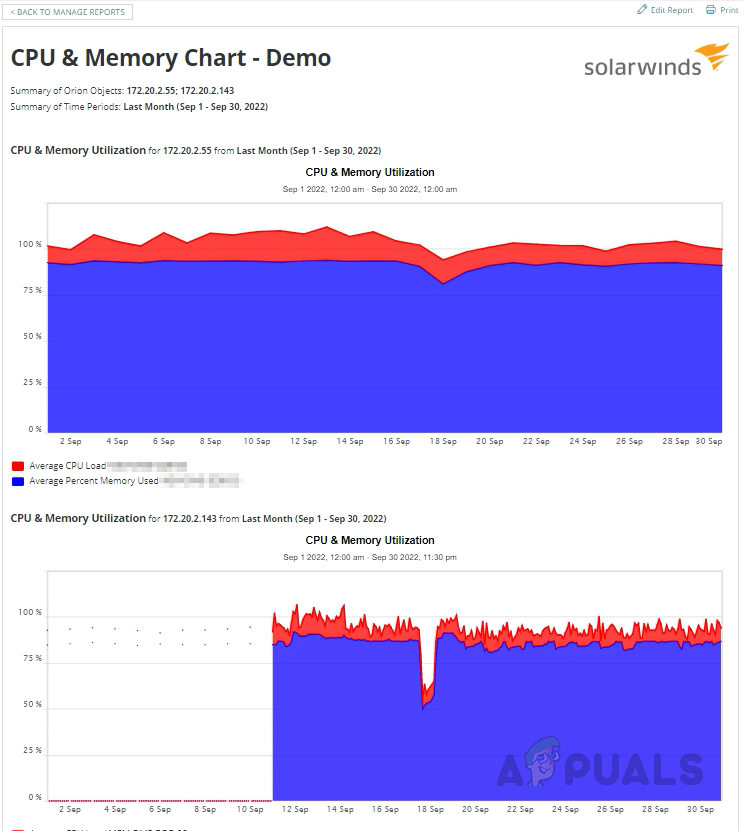
- We can see the created report. To download the report, click Print and save it as a PDF file.
This is how we can create a chart report for any monitored parameter in Solarwinds. As mentioned separate layout needs to be built for chart format reports.
3. Interface Bandwidth Utilization Report – Data
Follow steps 1 to 5 in Availability Report for Network Devices.
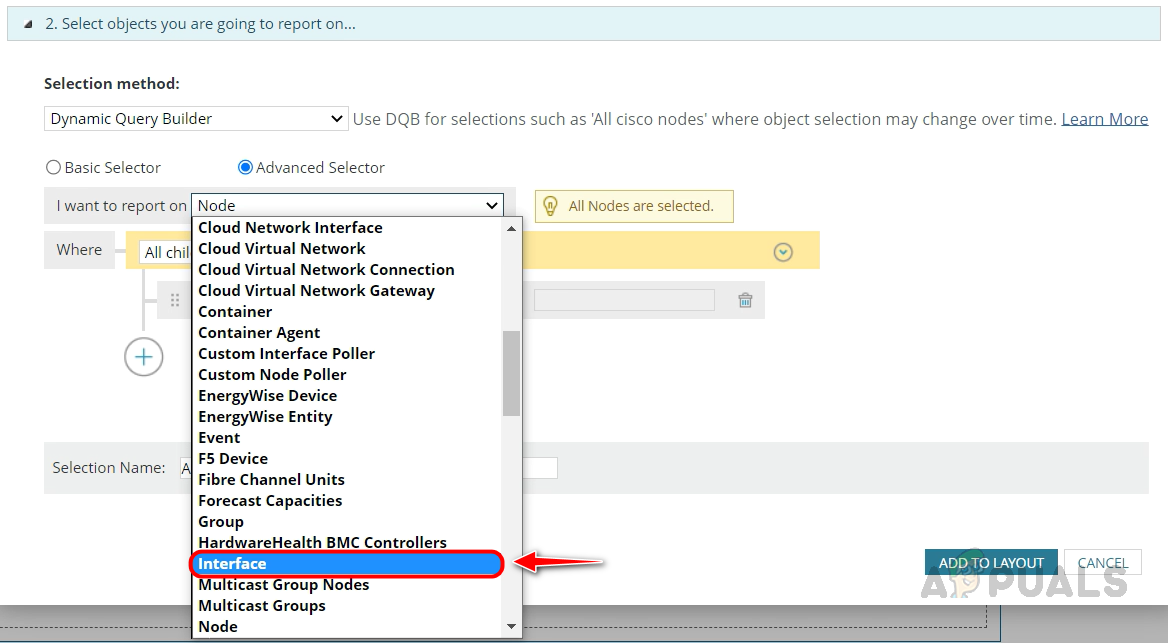
- Select Interface in I want to report on field.
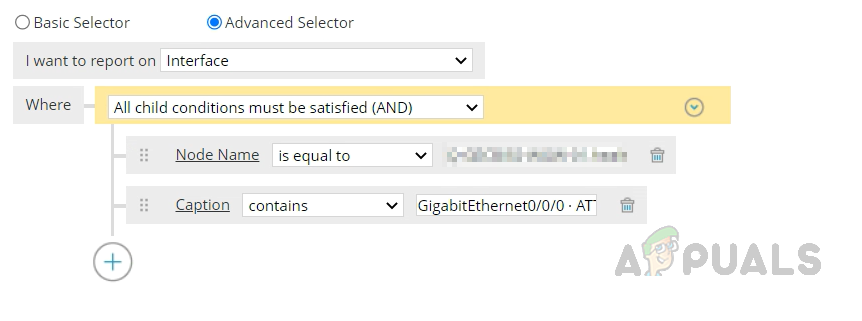
- We need to build the query to filter the interfaces required for this report. In this demo, we are going to filter WAN interfaces. If you have any custom property configured for WAN interfaces in Solarwinds, you can use that. You can use any common keyword in the interface description if you haven’t configured any custom property.
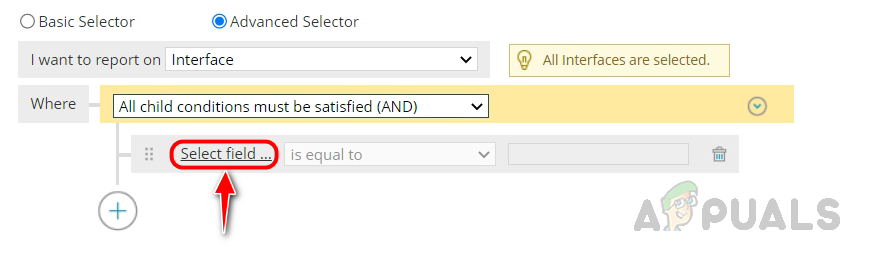
- Let’s build a query to filter WAN interfaces for this report. Click on the Select field.
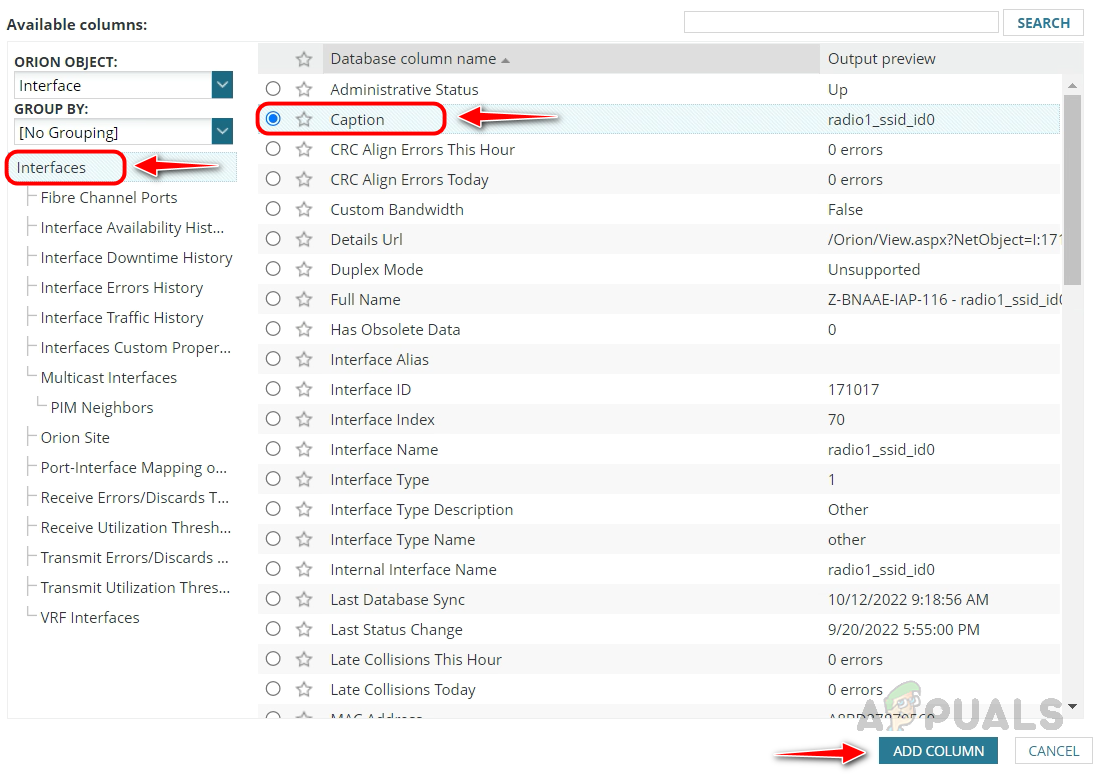
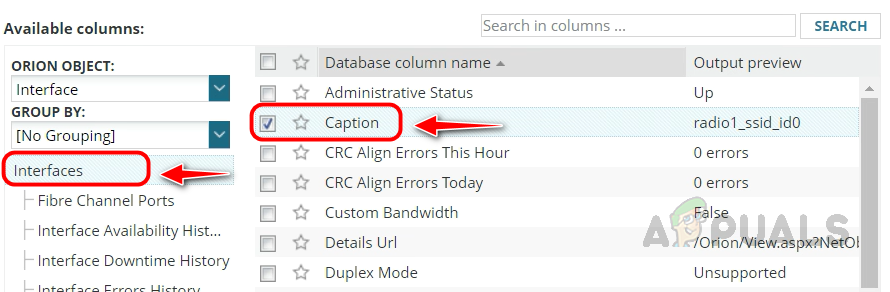
- Select Caption from the Interfaces table and click on Add Column.
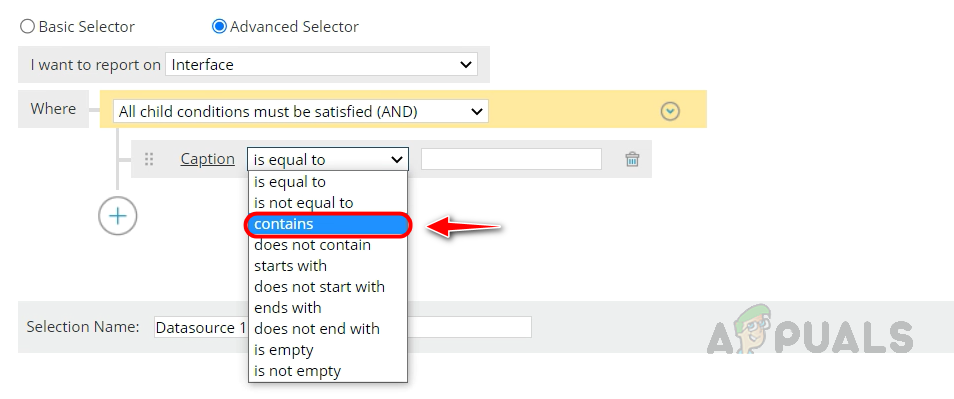
- Click on the drop-down list next to Caption in the query builder and select Contains.
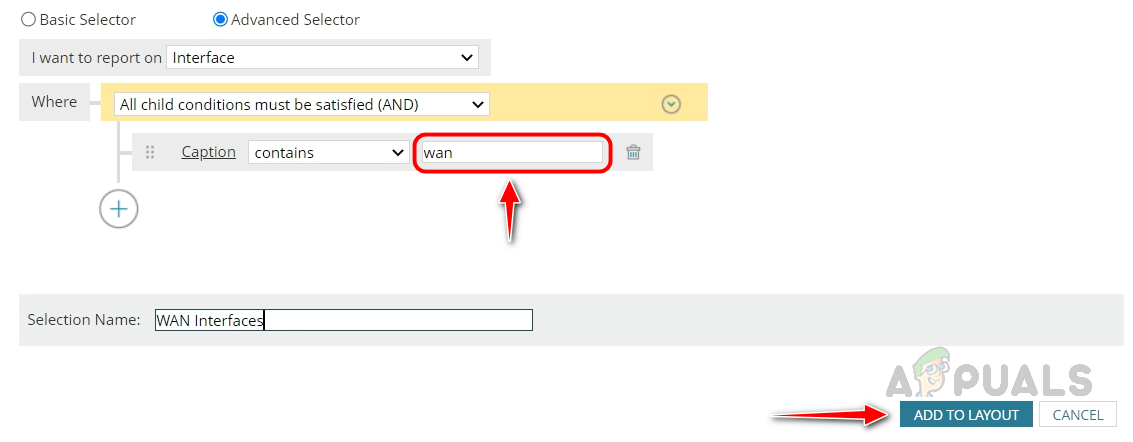
- Mention the keyword in the textbox to filter WAN interfaces and click Add to Layout.
- Let’s select the columns for the report and click on Add Column and select Caption from the Interface table.
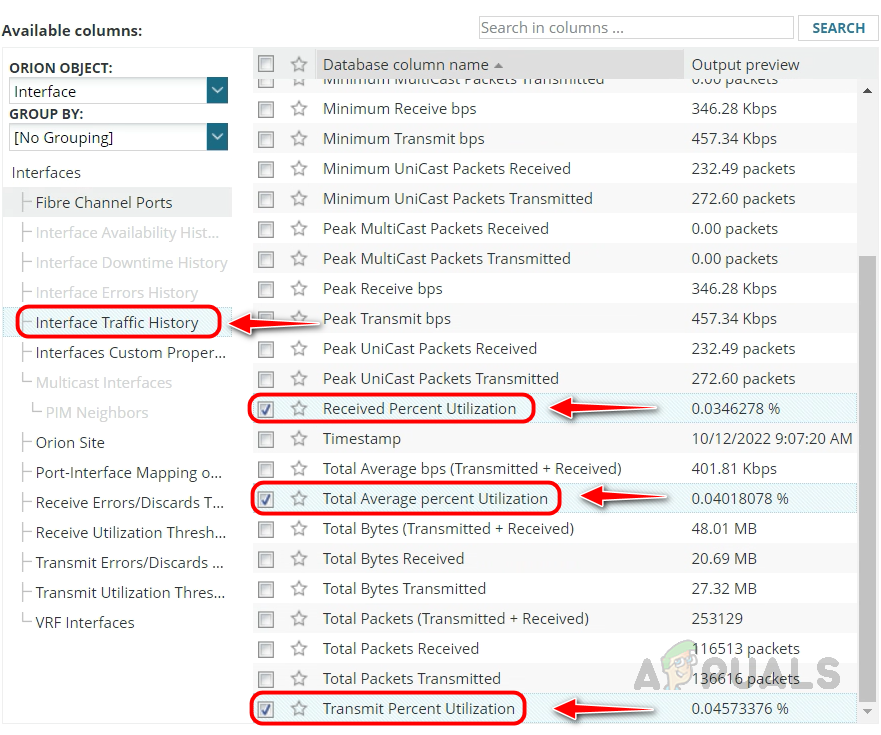
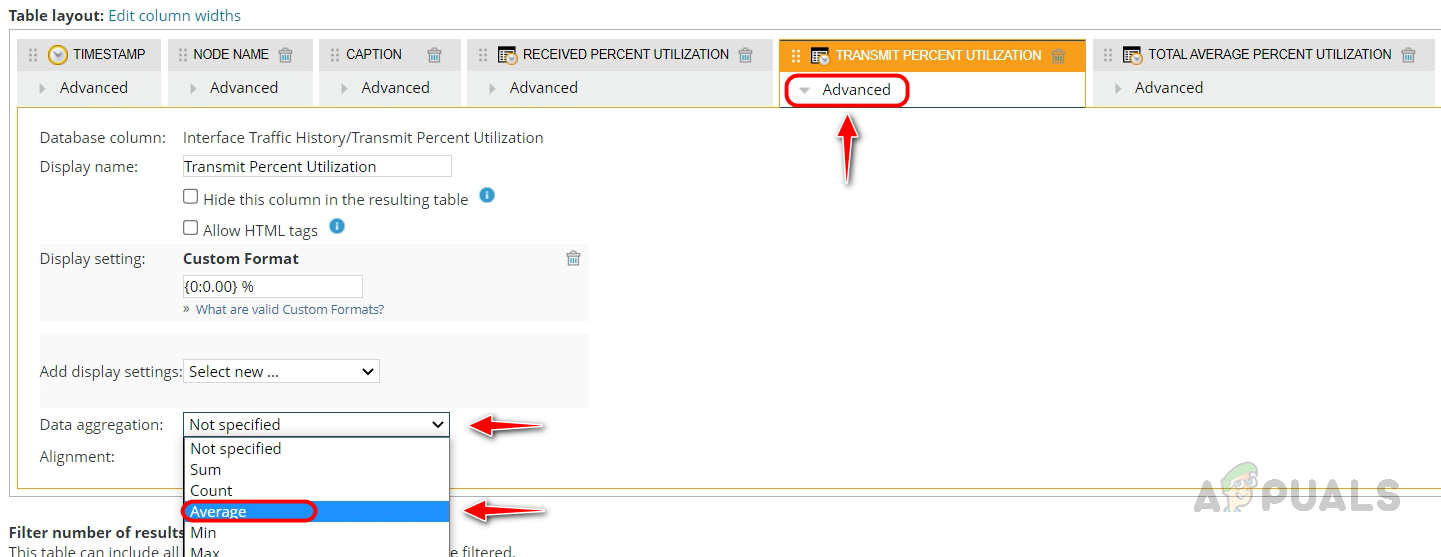
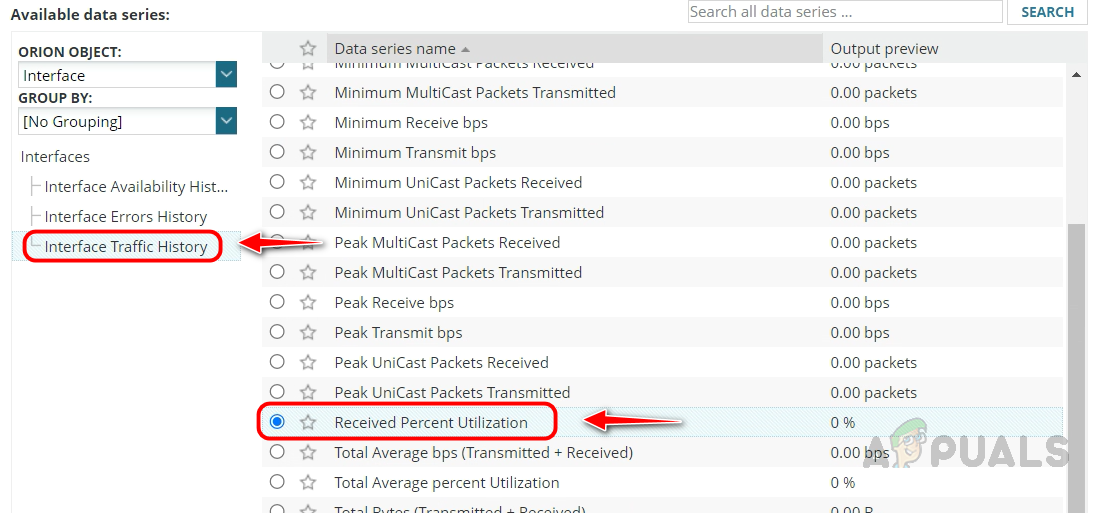
- Select Received Percent Utilization, Transmit Percent Utilization, and Total Average Percent Utilization from the Interface Traffic History table.
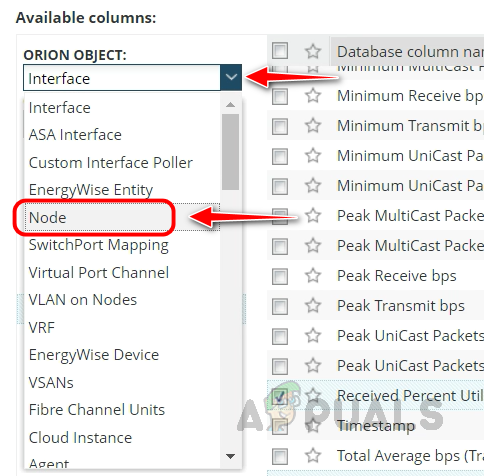
- We need to know the network device name to which the interface belongs. To do that, select Node from the Orion Object drop-down list.
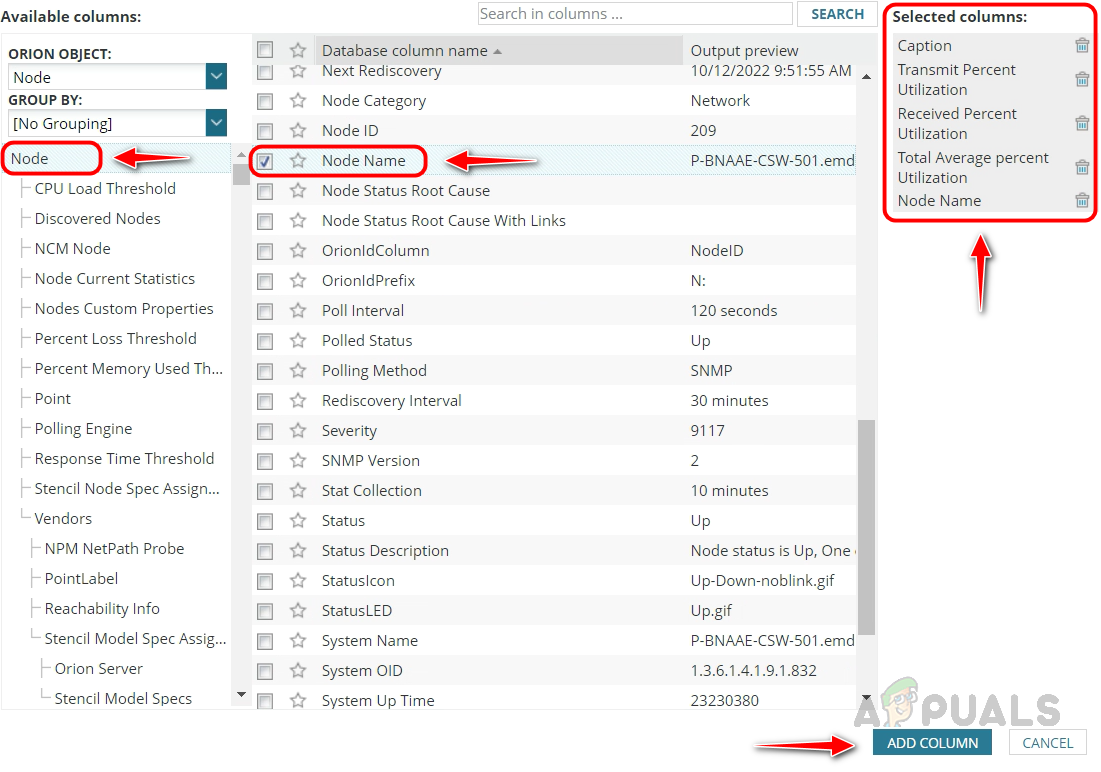
- Select Node Name from the Node table. Validate the columns in Selected Columns and click on Add Column.
- Rearrange the columns based on your needs.
- Click Advanced in Received Percent Utilization, Transmit Percent Utilization, and select Average in Data Aggregation to capture the average data in the report.
- Select Month in Sample Interval under Time-based settings and click on Submit.
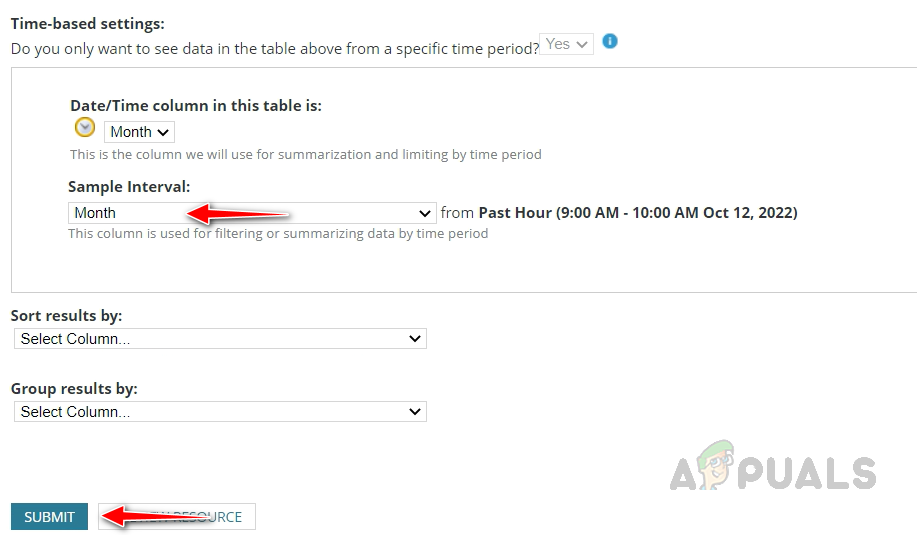
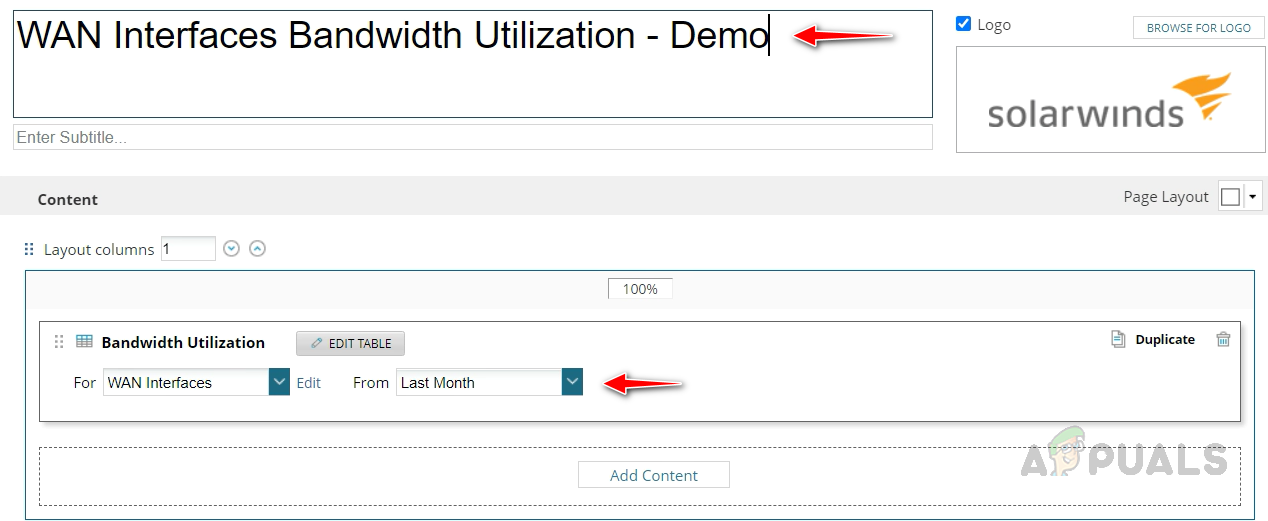
- Provide an appropriate name for the report, select Last Month for the report duration, and click Next.
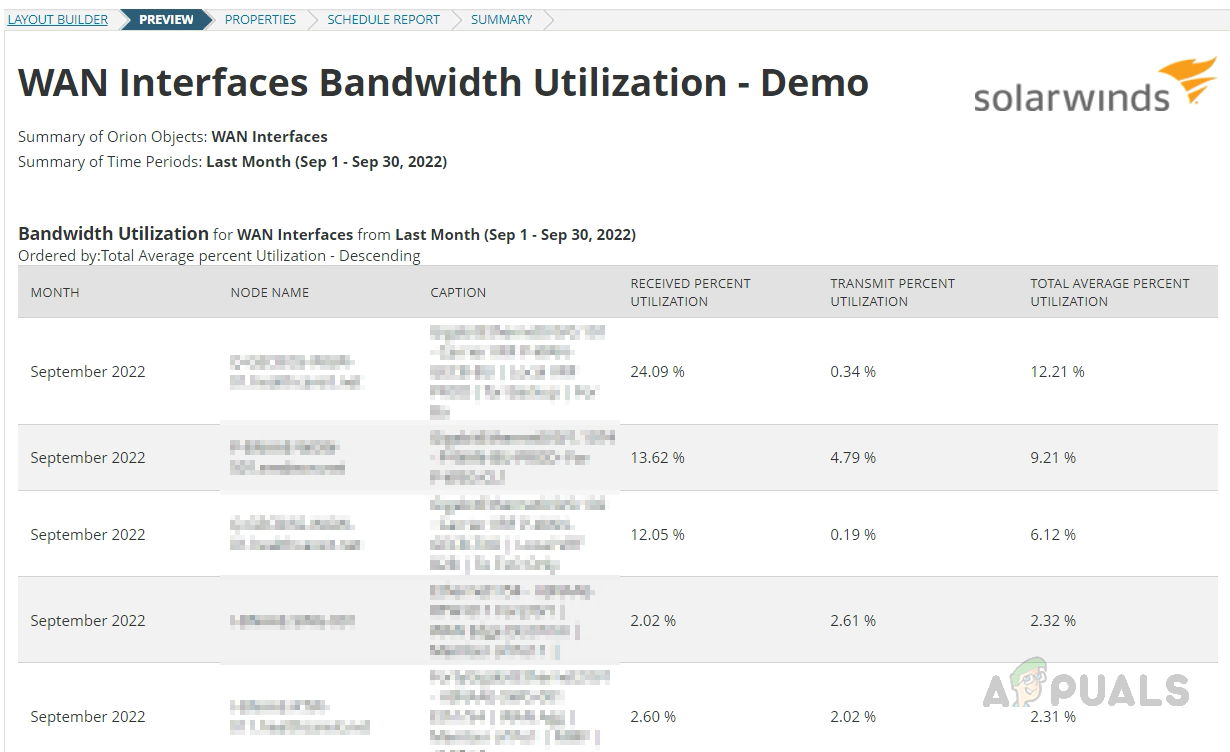
- A report preview will be shown. Click on Next to continue.
- Click on Next in the Properties and Schedule Report section.
- Review the report summary and check the Show created report after saving to view the created report and click on Submit.
- We can see the created report now. We can download the report in excel format or print the report by clicking on Export to Excel or Print.
This is how we can create reports in data format for Interfaces, let’s see how to create reports in chart format for interfaces.
4. Interface Bandwidth Utilization Report – Chart
- Follow steps 1 to 4 from the Availability Report for Network Devices demo and while selecting resource on the 5th step, choose Custom Chart and click on Select and Continue.
- As the above chart format report demo mentioned, we must create separate layouts for each interface.
- Let’s filter an interface from a specific node.
- Provide an appropriate name for the resource and click on Add Data Series.
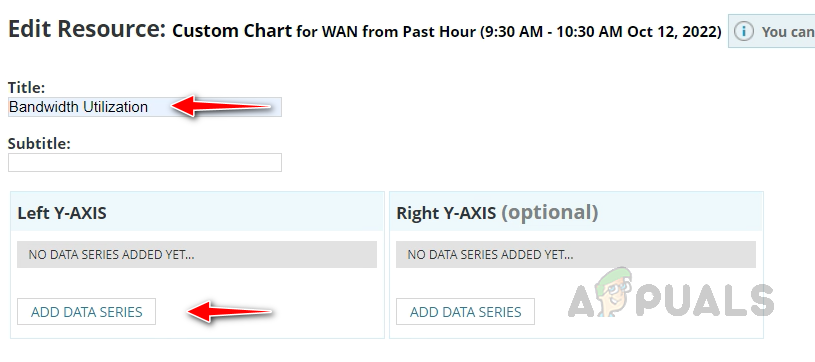
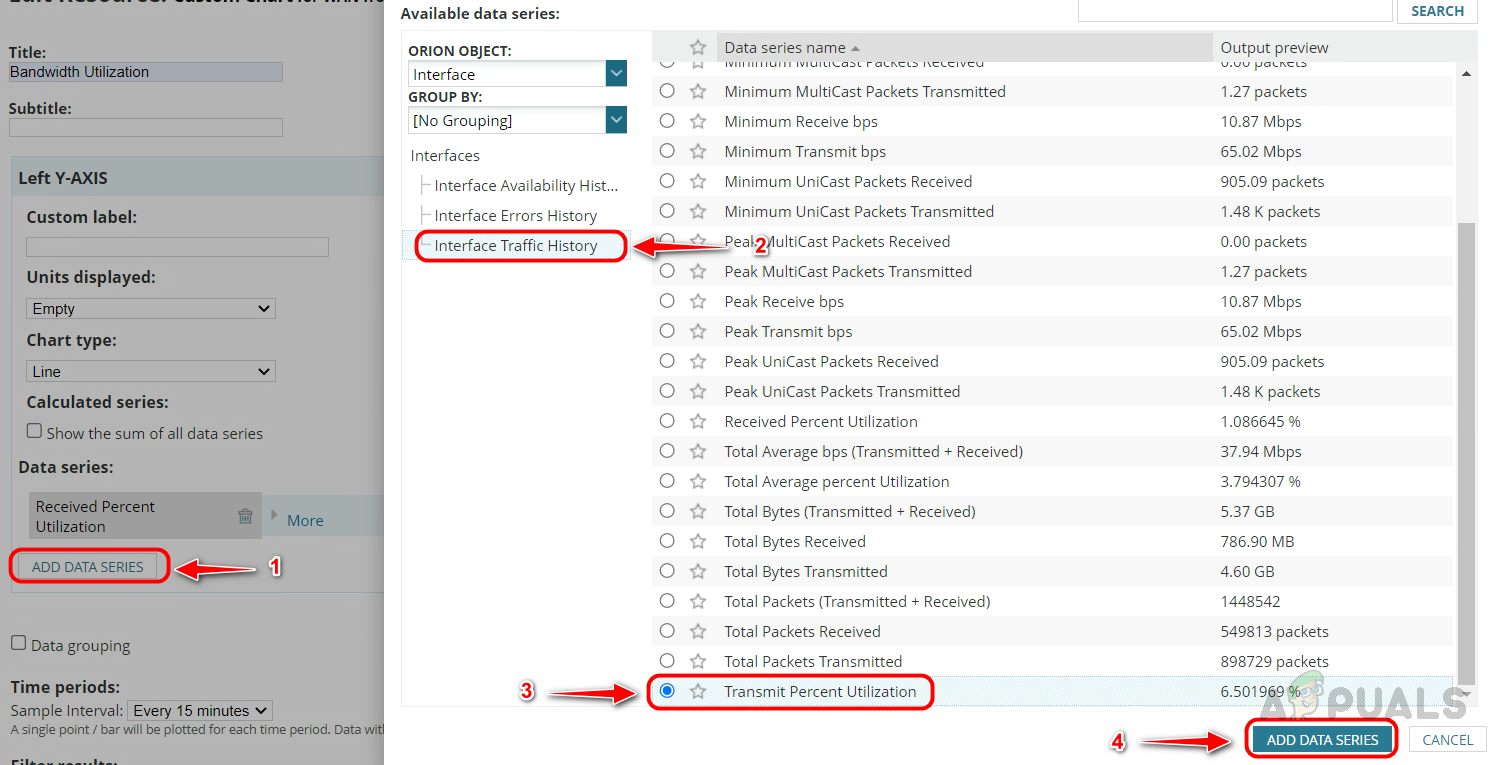
- Select Received Percent Utilization from the Interface Traffic History table and click on Add Data Series.
- Click on Add Data Series to add one more data, select Transmit Percent Utilization from the Interface Traffic History table and click on Add Data Series.
- Customize the added data series if required, as shown in the above demo. Select the Sample Interval and click on Submit.
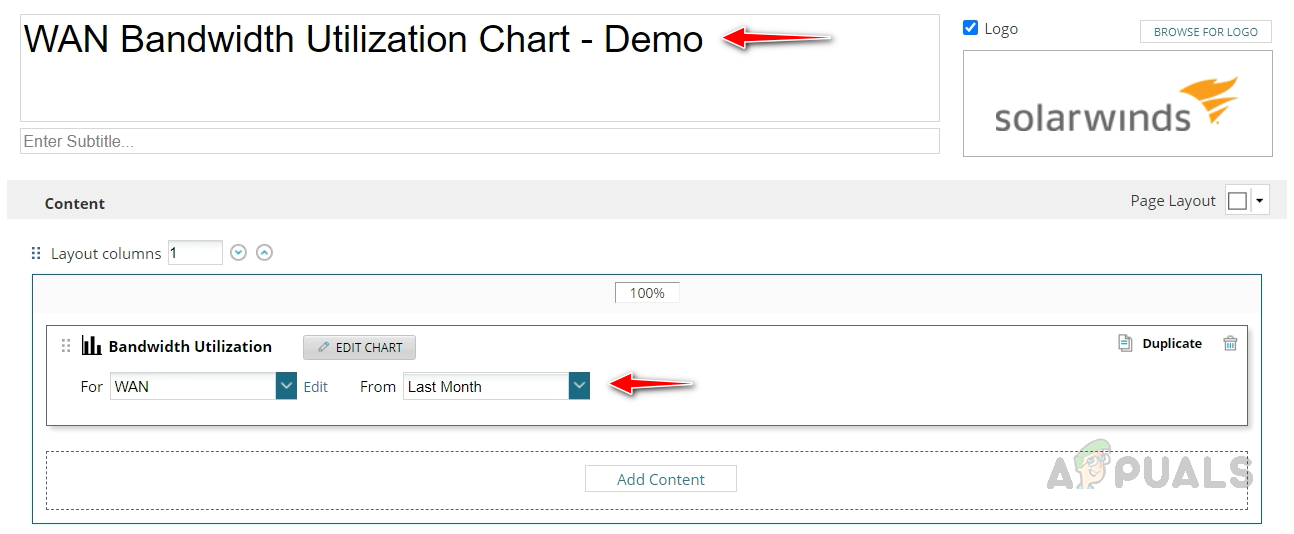
- Provide an appropriate name for the report, select report duration, then click Next.
- A preview of the report will be shown on the next page. Click on next in Preview, Properties, and Schedule Report pages.
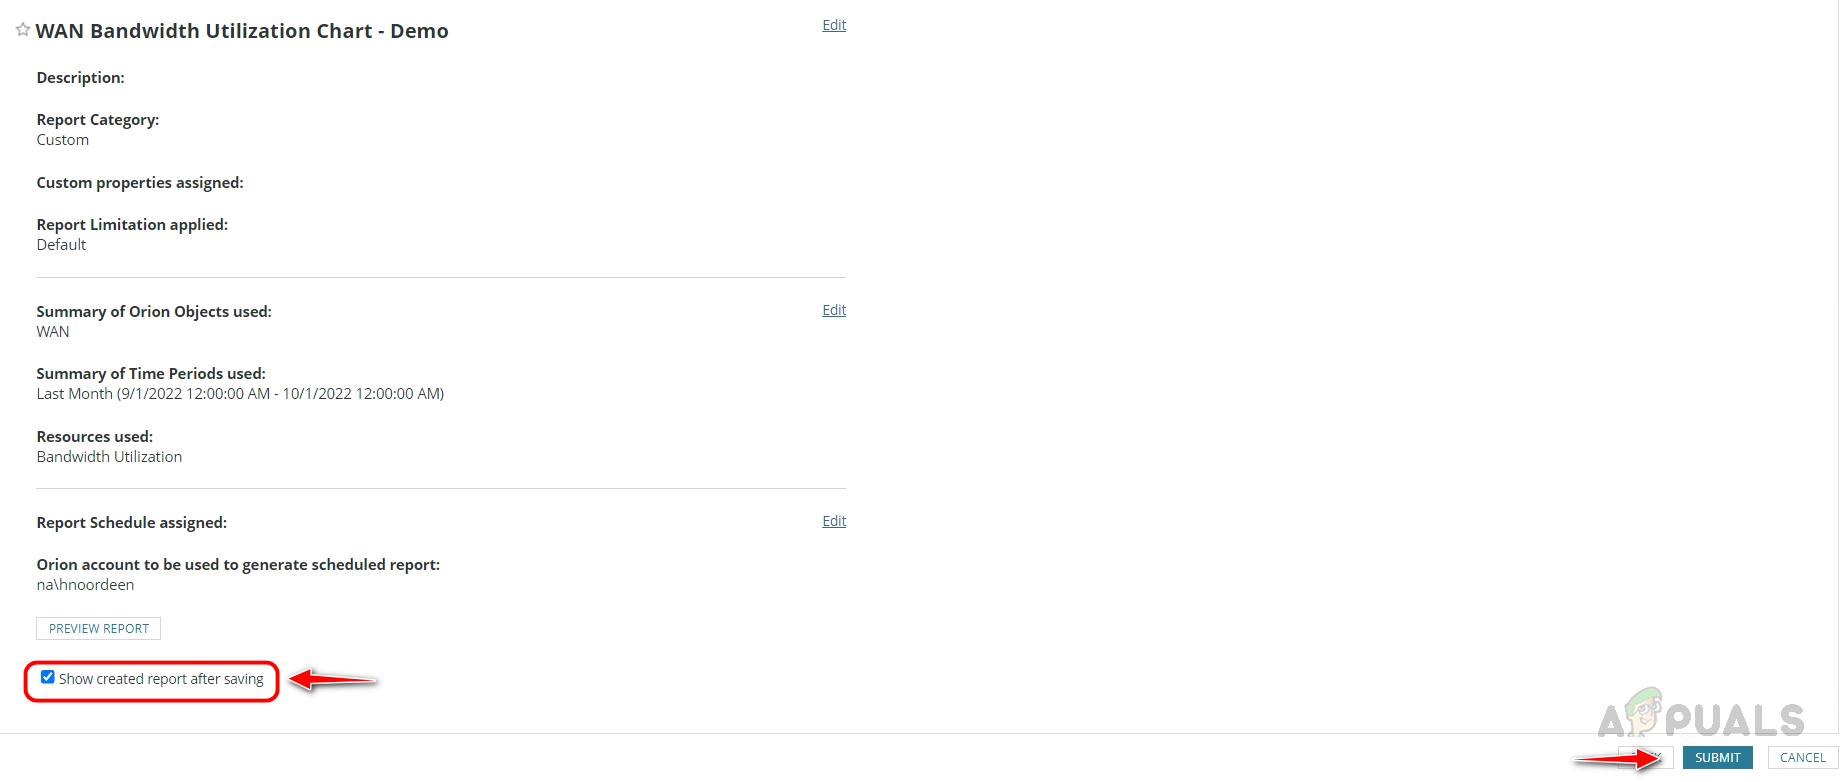
- Review the report summary and check the Show created report after saving to view the created report and click on Submit.
- Now, we can see the created report.
- To download the report, click Print and save it as a PDF file.
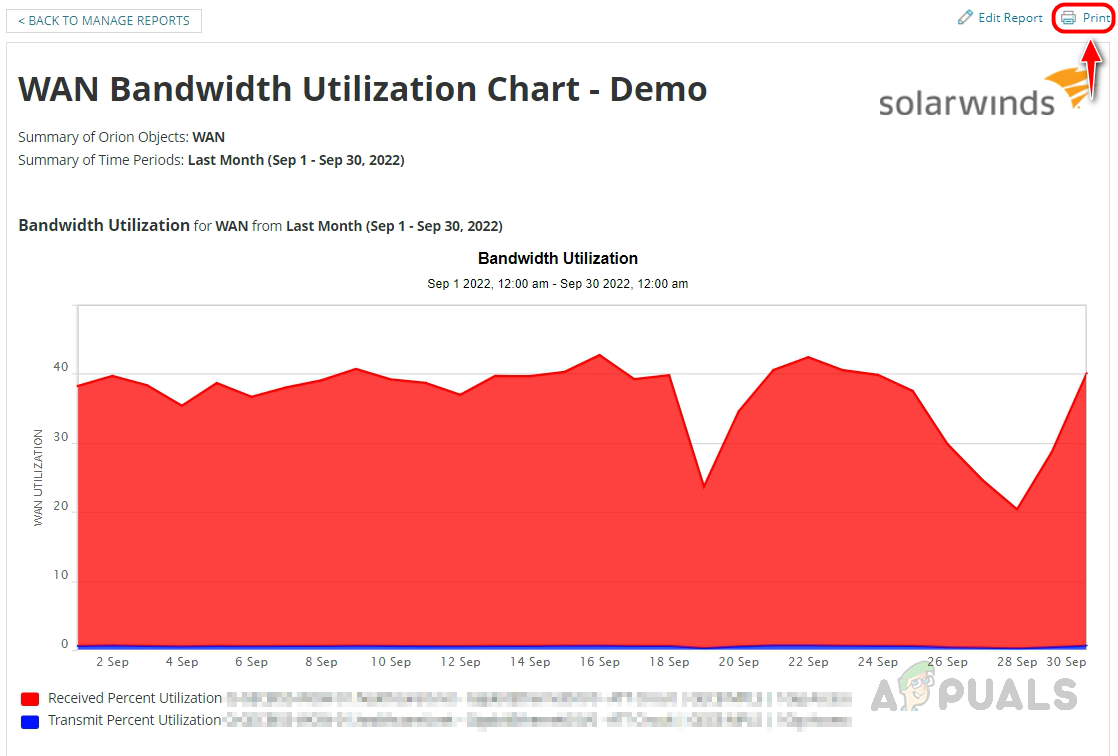
This is how we can create a chart format report for interface utilization. We can use these methods to create reports in chart or data format for all the metrics monitored in a device using Solarwinds.
Scheduling a Report to Deliver Automatically to a Set of Recipients Over Email
We have seen how to create reports. To automatically deliver the reports to recipients through Email, follow the below steps.
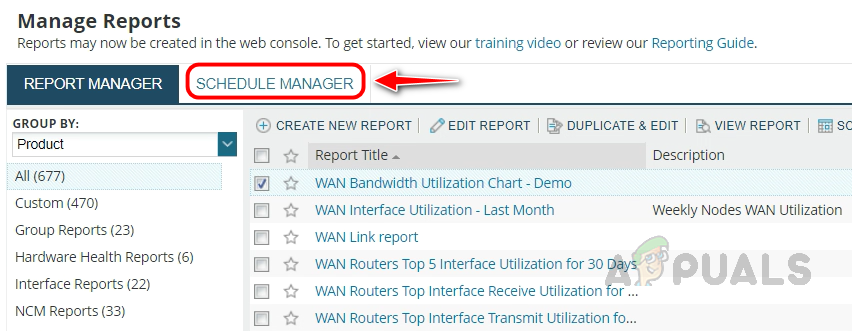
- Select Schedule Manager in Manage Reports.
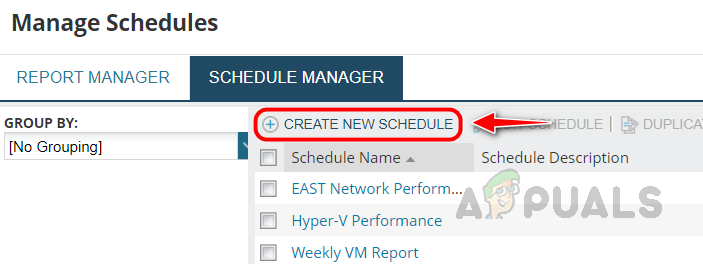
- Click on Create New Schedule.
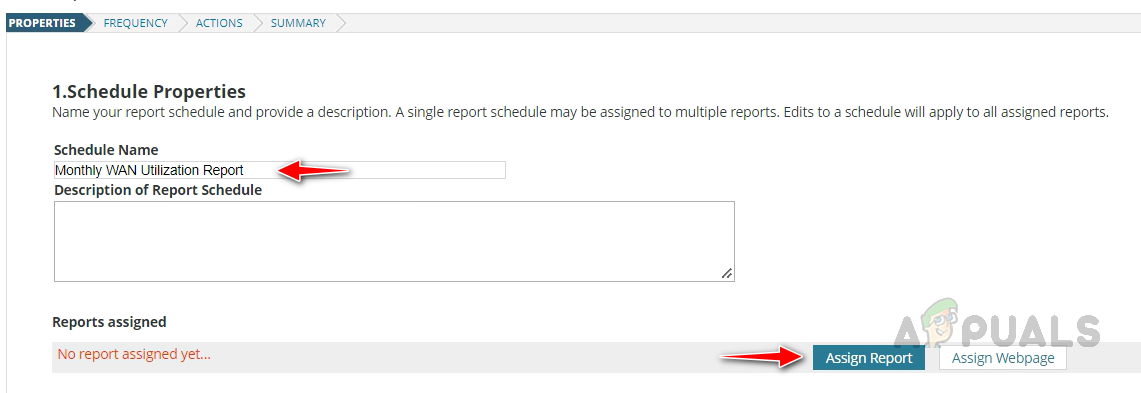
- Provide an appropriate name for the schedule, and click on Assign Report to choose the report you want to schedule.
- Search and select the report and click on Assign Report.
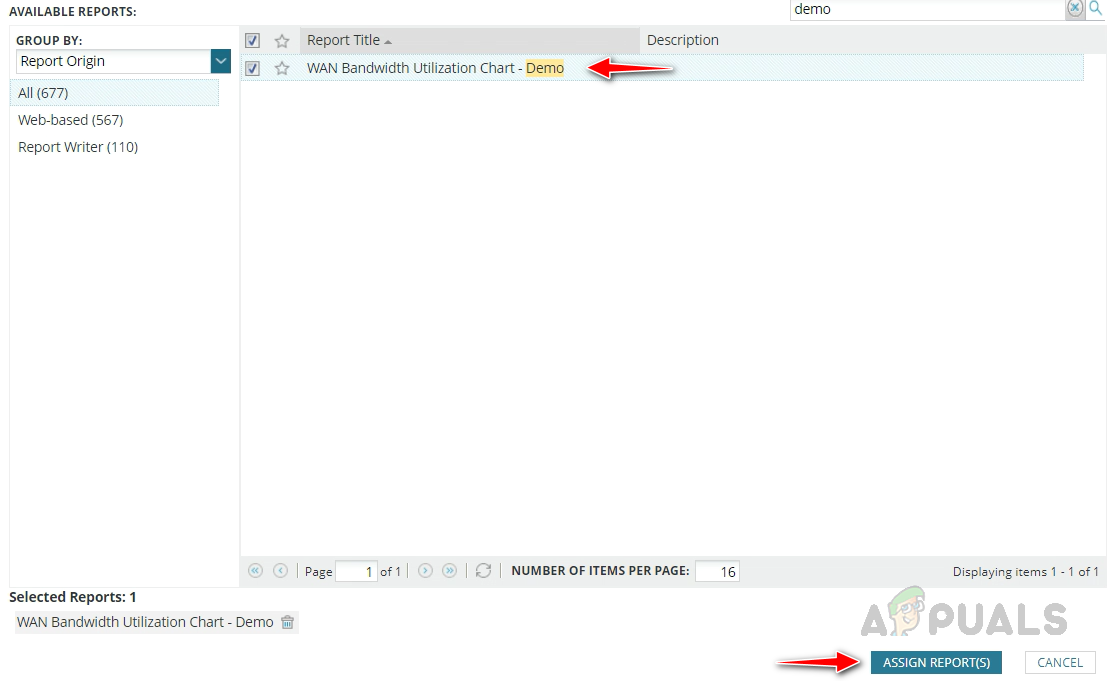
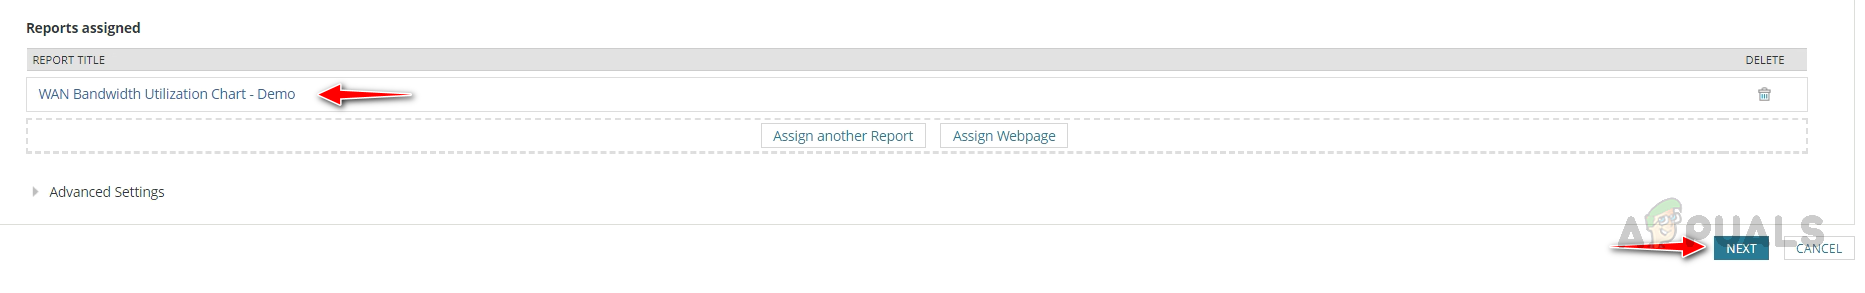
- We can see the selected report for the schedule. Click on Next.
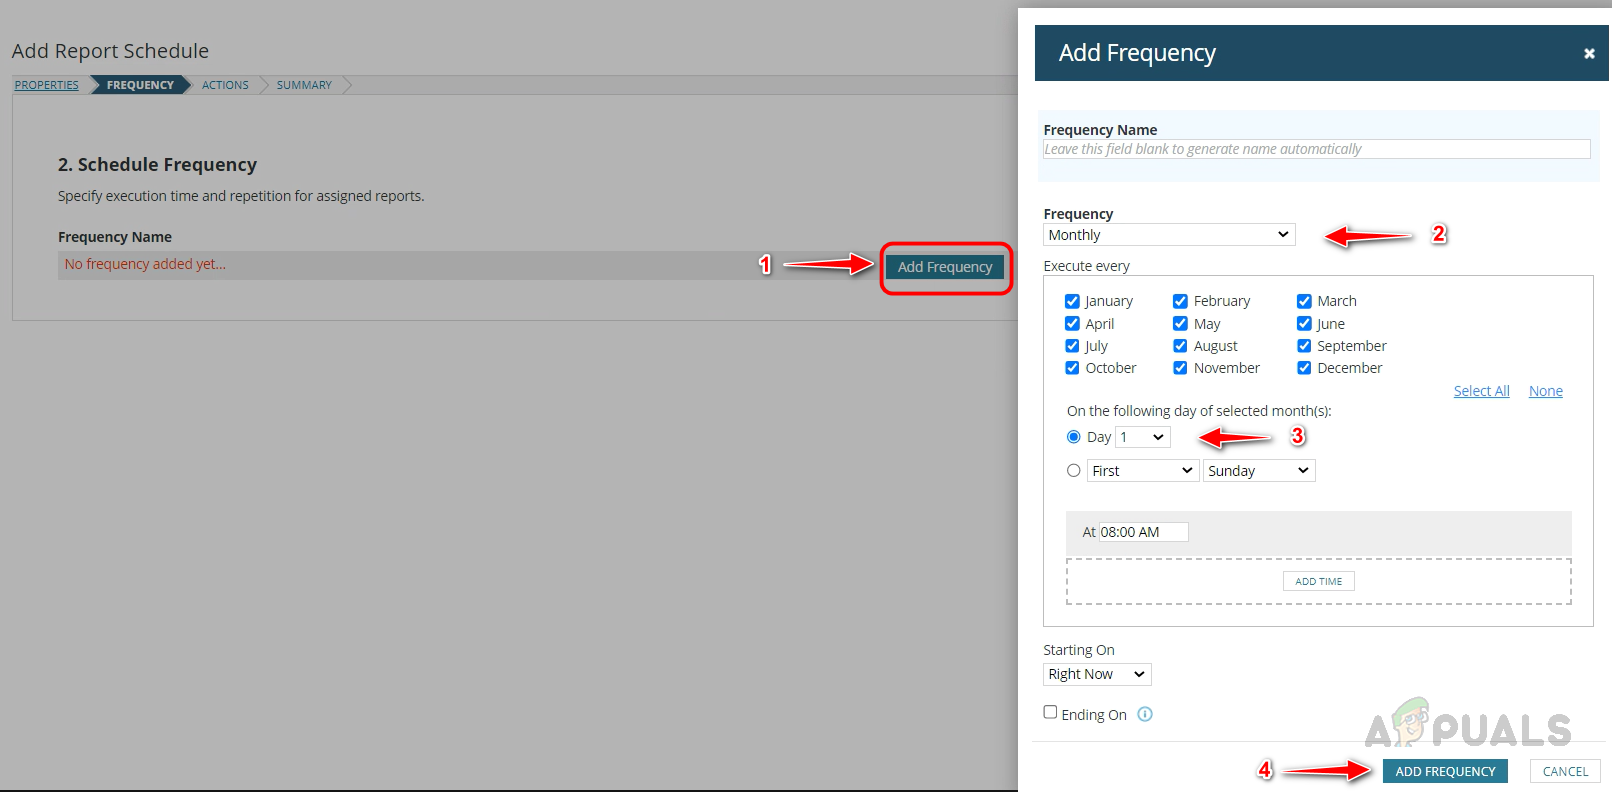
- On the Frequency page, click on Add Frequency. Select the preferred Frequency and choose when the report needs to be delivered. Once done, click on Add Frequency and click on Next.
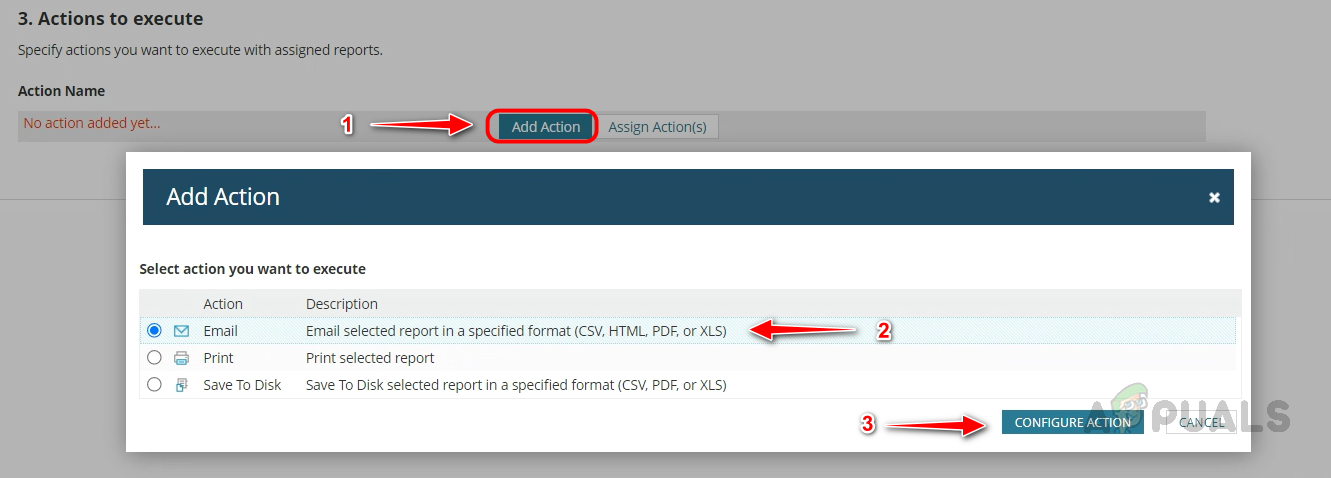
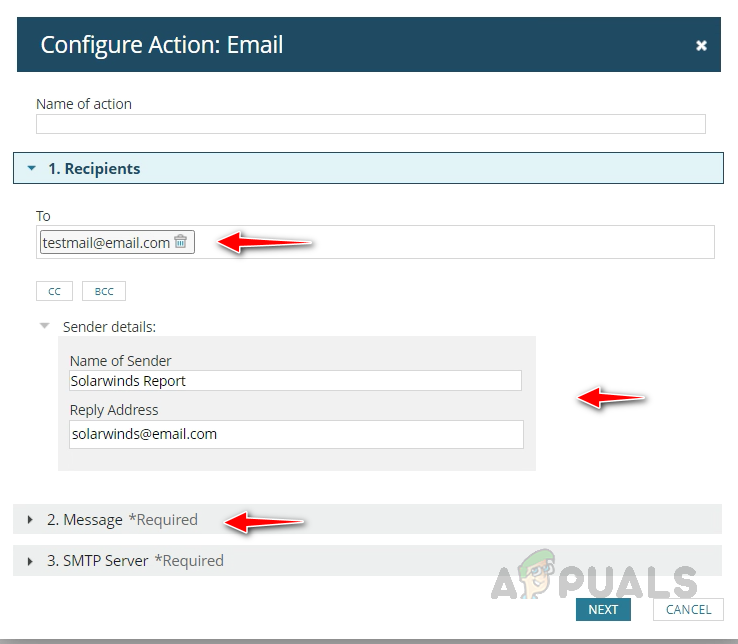
- On the Action page, click on Add Action, select Email action, and click on Configure Action.
- In the Email action, provide the recipient’s Email ID(s). You can use multiple Emails with a comma. Provide any name for Sender and provide a reply Email address. Once configured, click on Message.
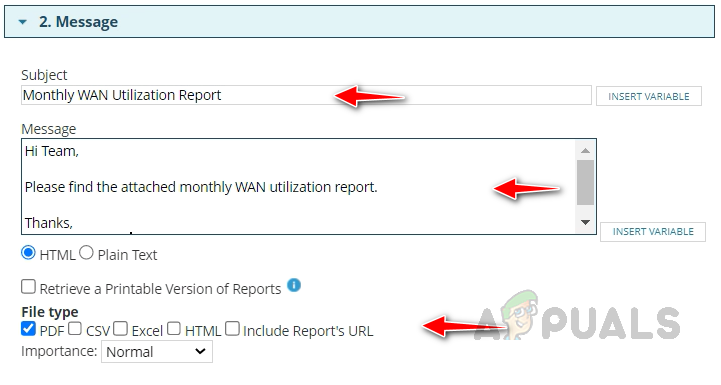
- Provide an appropriate subject and message body for the Email. Choose the File Type based on the report we created. For example, here I chose PDF since I am automating chart format report. If you are automating data
format reports, you can choose CSV or EXCEL. Also, you can include the report’s URL in the Email.
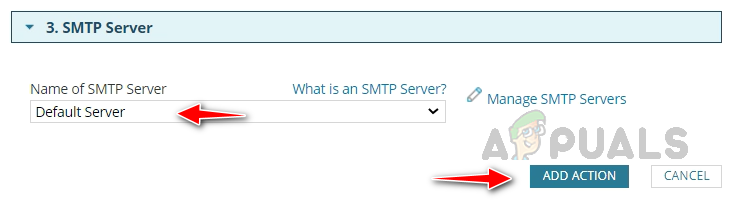
- Once configured, click on SMTP Server and choose your SMTP server. You can choose Default Server if you have already configured your SMTP server in All Settings. Once done, click on Add Action.
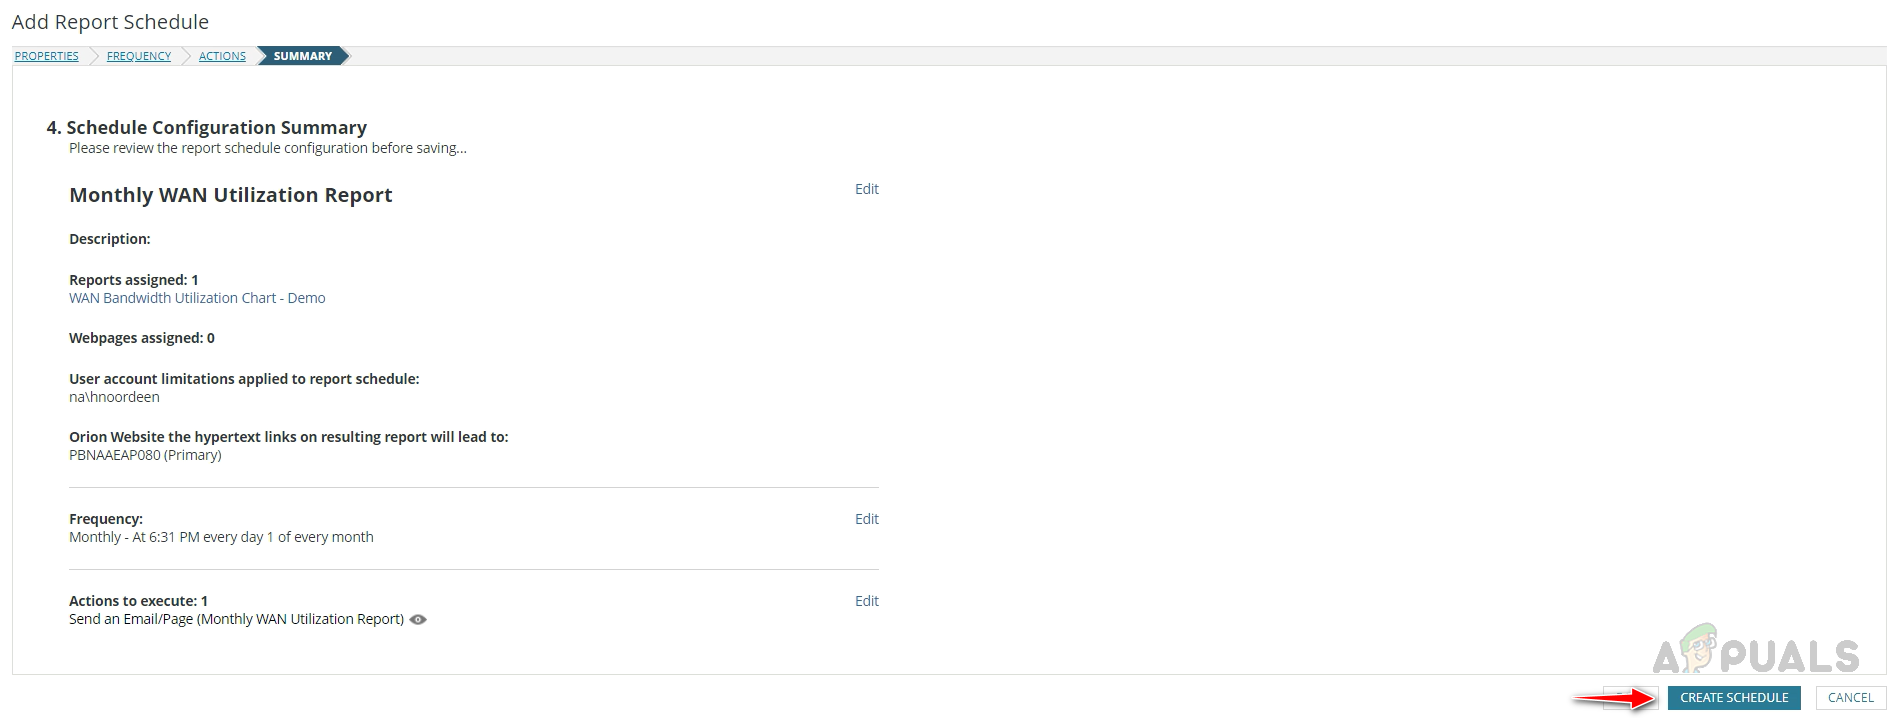
- Click Next and review the Summary. If all is good, click on Create Schedule.
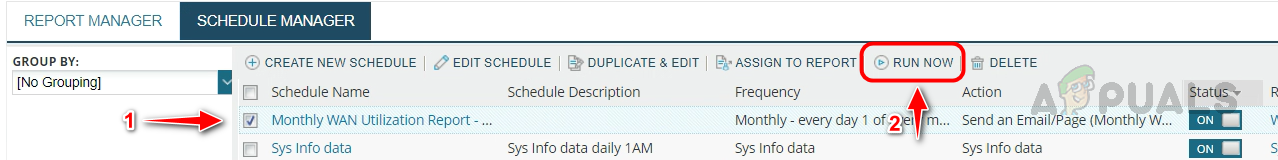
- We can see the created schedule to test whether it is working properly. Select the schedule and click on Run Now.
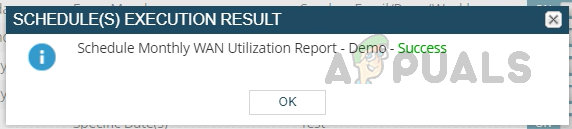
- You should get a Success message. If it failed, check your SMTP settings and ensure the sender Email you are using is allowed to send Emails.
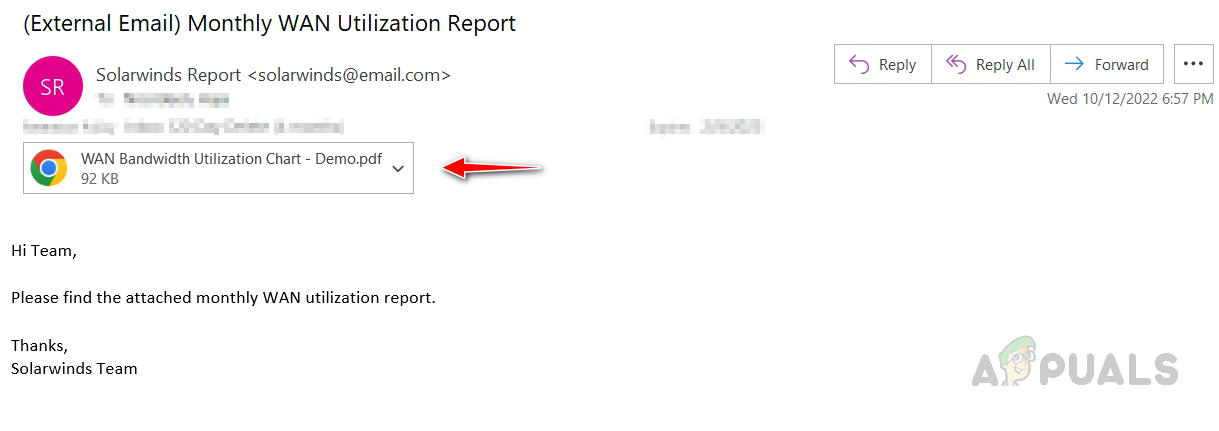
- Check your mailbox to ensure the report is received. I have received the email with the PDF attachment.
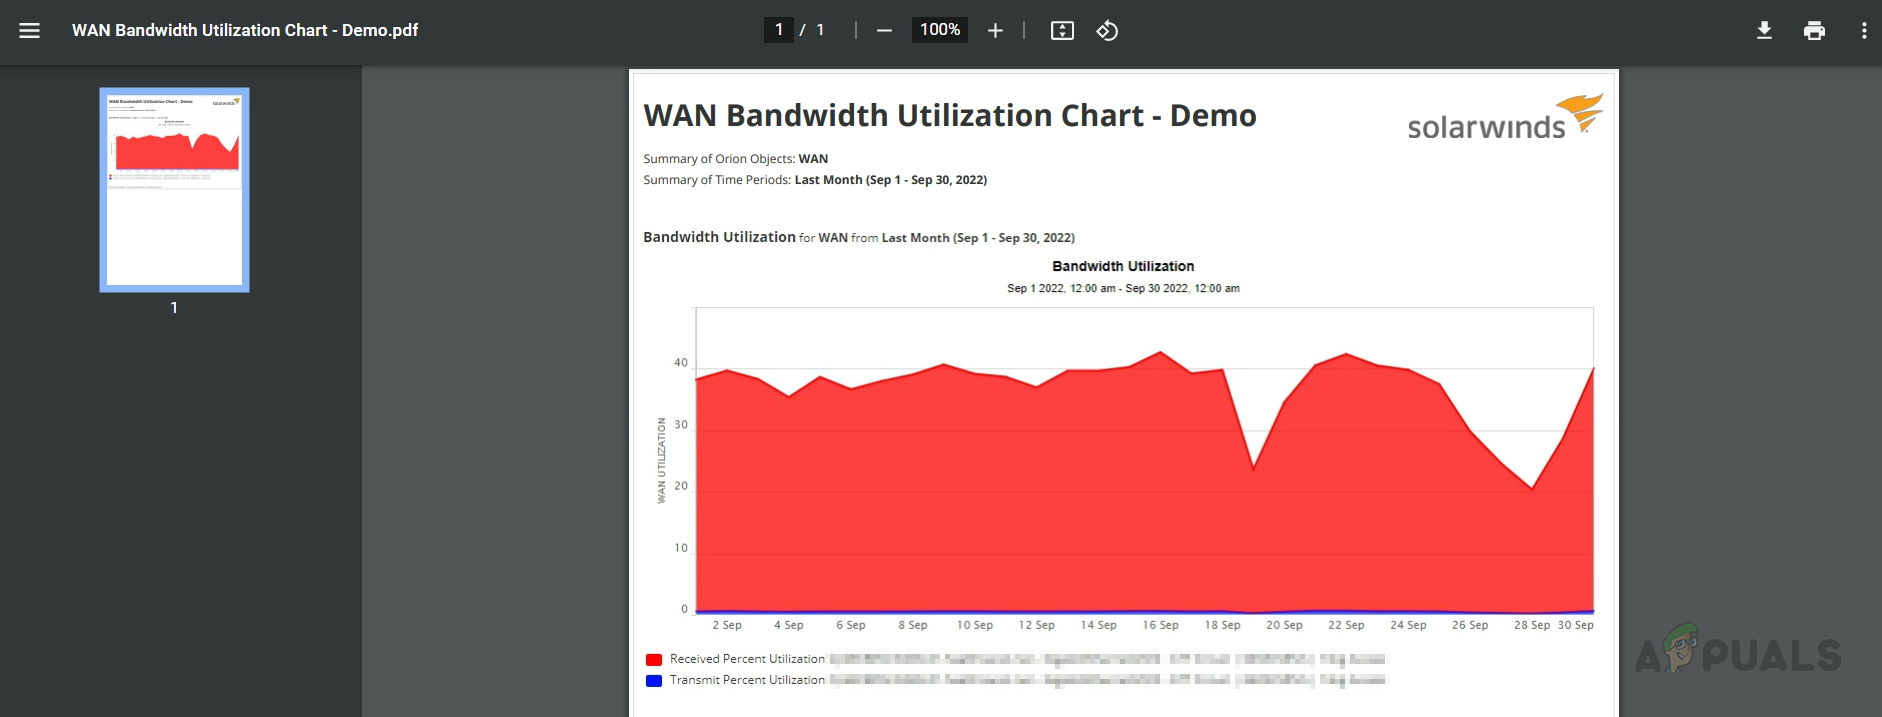
- Open the PDF file to review the report.
This is how we can automate a report to deliver to a set of recipients over Email. Apart from Email, we can save the report in a shared folder or directly send it to a printer to print the report if required. Solarwinds is loaded with lots of predefined reports.
We can use those reports as templates to create a custom report of our own by duplicating the report. The reporting feature is available in all Solarwinds products. Click on this link to learn about Solarwinds and try the feature.